
Performance
What is a good solar panel efficiency?
Where 21, 22 and 23 % efficiency sit in our module catalogue, by cell type and size, what efficiency changes on a roof and when it is worth paying for.
In short: Efficiency tells you how many watts a module puts on each square metre, nothing about how many kilowatt hours each of those watts makes. Our catalogue's median module states 21.8 %, and the middle 80 % sit between 19.6 and 23.2 %. A "good" figure is one that puts the power you need on the roof you have; if the roof has room to spare, pay for watts, not for efficiency.
Efficiency is the number shops print biggest after the wattage, and the one buyers ask about first: is 21 % good, is 23 % worth the extra? The answer depends less on the number than on your roof. Here is where the figures sit in our catalogue, what moves them, and when a higher one earns its price.
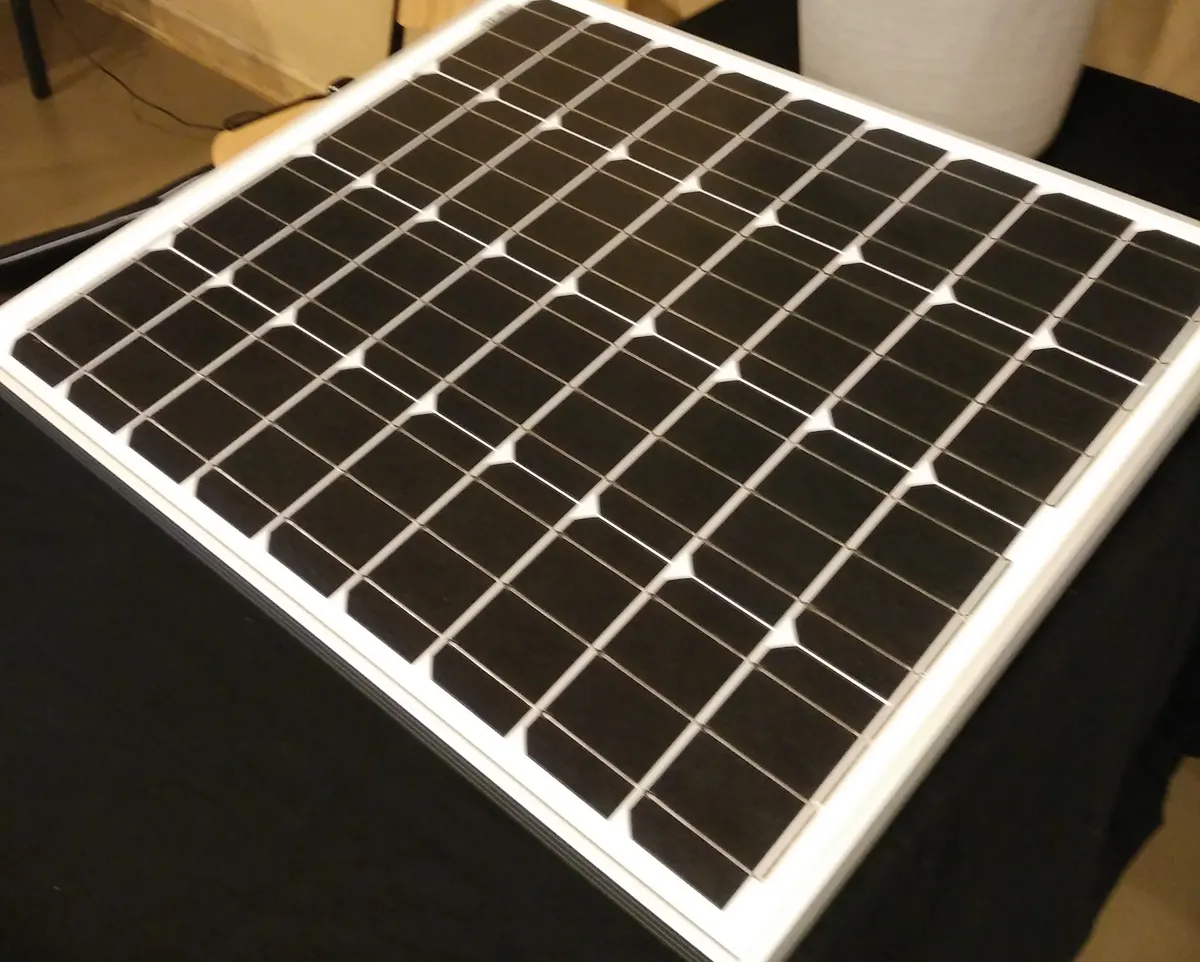

What the efficiency figure measures
Module efficiency is the rated power divided by the light falling on the module's whole outer area, frame included. Light means 1000 W per square metre of a reference sunlight spectrum, with the cells at 25 °C: the standard test conditions. The spectrum is defined in IEC 60904-3, and PVEducation gives the same definition for a cell: "the ratio of energy output from the solar cell to input energy from the sun", measured "under AM1.5 conditions and at a temperature of 25°C".
Because the light is fixed at 1000 W/m², efficiency and watts per square metre are the same figure. A 22 % module delivers 220 W on every square metre it covers. You can check any datasheet yourself: divide the rated power in watts by the length times the width in metres, then by ten. Across our catalogue that sum matches the printed efficiency within 0.1 point for 13,426 of the 13,983 modules that state all three fields, and the median module puts 218 W on a square metre.
The photo above shows why a module's efficiency always sits below its cells'. The light falling on the white gaps between the cells and on the frame counts in the module's area and produces nothing. Shops sometimes quote cell efficiency; the module figure is the one that tells you what fits on a roof.
Where the catalogue sits
The histogram below has every module that states an efficiency, one bar per bin, with the median marked.
The numbers behind the chart
| Module efficiency (%) | Modules |
|---|---|
| <17 | 532 |
| 17-18 | 228 |
| 18-19 | 266 |
| 19-20 | 680 |
| 20-21 | 2,349 |
| 21-22 | 3,209 |
| 22-23 | 4,500 |
| 23-24 | 1,888 |
| 24+ | 346 |
The table answers the question as it's usually asked. It gives the share of modules at or above each figure. Where a row's share is above half, that figure sits below the catalogue median: most modules reach it.
| Efficiency | Share of modules at or above it |
|---|---|
| 21 % | 71 % |
| 22 % | 48 % |
| 23 % | 16 % |
So read a figure on a shop page against these rows, not against an idea of what sounds high. The catalogue median is 21.8 %, the 10th percentile 19.6 % and the 90th percentile 23.2 %. A module below the 10th percentile is often an older design or a special build, such as a small off-grid panel or a coloured facade module, and you should know which before you buy it.
For scale, two figures from outside our data. Fraunhofer ISE's Photovoltaics Report (July 2026) puts the average efficiency of crystalline silicon modules shipped in Q4 2024 at 22.7 %, weighted by shipments, and the best laboratory module at 26.0 %. Our median weighs every power rating of every datasheet equally instead, sold or not, so the two figures answer different questions. The champion modules on the National Laboratory of the Rockies' chart (formerly NREL) are confirmed by independent labs such as Fraunhofer ISE and JRC-ESTI and measured to the same reference spectrum at 25 °C; they show where the technology is going, not what a shop sells.
These are the most efficient modules in the catalogue, picked by the rule in the caption:
Top 3 by efficiency, one module per datasheet, among 12,655 modules of 300 W or more with a stated cell technology and a stated efficiency, as of the last catalogue sync.
Scorecard for this module: open its page on ComparePV.
Scorecard for this module: open its page on ComparePV.
Scorecard for this module: open its page on ComparePV.
Efficiency by cell technology
Most of the spread comes from the cell. The table gives each technology's median, the range of its middle 80 % and the share reaching 22 %. Check the module count before trusting a median: a small group can move with one manufacturer's datasheets.
| Cell technology | Modules | Median | 10th to 90th percentile | 22 % or more |
|---|---|---|---|---|
| PERC | 4,306 | 20.7 % | 19.1 to 21.5 % | 1 % |
| TOPCon | 5,733 | 22.5 % | 21.5 to 23.3 % | 77 % |
| HJT | 697 | 22.6 % | 21.1 to 23.4 % | 78 % |
| Back contact | 440 | 23.6 % | 22.3 to 24.5 % | 93 % |
| "N-type" only | 1,656 | 22.5 % | 21.3 to 23.5 % | 76 % |
The practical use of this table: judge a module against its own technology, not against the whole catalogue. A figure that is ordinary for one cell can be the top of another's range. Where one group's 90th percentile sits below another's 10th, nearly every module of the first is less efficient than nearly every module of the second; where the ranges overlap, the single datasheet matters more than the label. Why the cells differ is the subject of the TOPCon or PERC article.
Efficiency by module size
A bigger module has more watts, but not necessarily more watts per square metre. The table splits the catalogue by outer area, the four size classes of the article on module sizes.
| Outer area | Modules | Median power | Median efficiency |
|---|---|---|---|
| under 2.0 m² | 4,997 | 415 W | 21.3 % |
| 2.0 to 2.4 m² | 2,613 | 480 W | 21.6 % |
| 2.4 to 2.8 m² | 4,456 | 585 W | 22.3 % |
| 2.8 m² and up | 1,924 | 675 W | 22.2 % |
Compare the two right-hand columns. The power column follows the area almost by definition. The efficiency column is a separate question. A bigger frame doesn't make a module more efficient by itself; a gap between these rows mostly comes from which cells each class carries, so the technology table above is the better guide. Don't read a high wattage on a shop page as a sign of a better module; divide it by the area first.
Efficiency changes the area, not the yield per kWp
This is the part most comparisons get wrong. A system's size is its rated power in kilowatt peak, and its yearly output per kWp, the specific yield, is set by the site: sun, tilt, shading, temperature and the inverter. Efficiency isn't in that list. Two 6 kWp arrays on the same roof make about the same energy whether they're built from 20 % or 23 % modules; the 23 % array is just smaller.
How much smaller is a short sum. One kWp at standard test conditions needs 1 / (efficiency × 1 kW/m²) of module area:
- at 20 %: 1 / 0.20 = 5.0 m² per kWp, so 30.0 m² for 6 kWp
- at 22 %: 1 / 0.22 = 4.55 m² per kWp, so 27.3 m² for 6 kWp
- at 23 %: 1 / 0.23 = 4.35 m² per kWp, so 26.1 m² for 6 kWp
Going from 20 to 23 % saves about 3.9 m² on a 6 kWp system, roughly two modules' worth of roof. Read the other way, the same 30 m² carries 6.9 kWp of 23 % modules instead of 6.0 kWp: 15 % more power, which is the efficiency ratio 23 / 20.
There is one way the yield per kWp can differ between two modules, and it isn't the efficiency figure: losses in heat. The temperature coefficient, the share of power lost per degree of cell temperature, depends mostly on the cell technology, not on the efficiency figure. Compare it on its own; the hot climate article does.
When higher efficiency is worth paying for
When the roof is the limit
If the roof fills up before you reach the power you want, efficiency is what you are buying: every point turns into more kWp on the same area, in the ratio above. On a small roof, though, only whole modules count, so the format decides how many fit before efficiency decides how much each one gives. The figure below shows it on an example roof; the small roof article works through it in full.
How many modules fit a small roof
Set the roof, the margin and the module size, turn the modules, add a chimney and drag it, and watch the grid fill the roof to scale.
How this is computed
The count is the roof-fit selector's own rule: modules in a plain grid, all portrait or all landscape, edge to edge in a row (clamp gaps of a few millimetres are ignored), rows up the slope separated by the row gap, and the edge margin kept free on all four sides. Portrait means the module's length runs up the slope. Modules in a row = floor(usable width / module width across), rows = floor((usable height + gap) / (module height + gap)).
The grid is drawn centred across the roof and starting at the eaves margin. A module that overlaps the chimney is dropped and the rest stay where they are; the figure does not rearrange the grid around it, which a planner sometimes can by shifting a row. Draw the chimney with the clearance your installer needs around it.
Total power is the module count times the rated power, and the share of the roof covered is the modules' area over the whole roof. The recommendation tries each of the five common sizes in both orientations on the same roof and chimney and keeps the most kWp. It ignores fire setbacks beyond the margin, mixed orientations, roof shape other than a rectangle and the mounting system's own spacing rules.
Illustrative model, not a measurement.
When it isn't
If the roof has room to spare, you are buying kWp and the efficiency figure only says how much roof they take. Compare price per watt, and remember the mounting: a less efficient array needs a little more rail and a few more clamps for the same power, which is the one real cost of the extra area.
What the step up costs
Inside one shop, the premium for efficiency is easy to see. Of the 13 Polish shops that list matched modules of both 21.5 to 23.5 % and 23.5 % and up, 11 charge more per watt for the more efficient ones, and the median difference is 6 %. On a full roof that premium buys power you couldn't fit otherwise, in the ratio of the two modules' efficiencies. But the premium applies to every watt on the roof, not only to the extra ones, so the extra watts cost more than the shop's price per watt suggests. They're worth it when you need that power and the roof can't take more of the cheaper module; if it can, the cheaper module wins. The power class article covers the other thing that moves price per watt, the module's size.
What to look for when buying
- Measure the roof first. If it holds the power you want with room left, efficiency is a tie-breaker and price per watt decides. The roof-fit selector tries every module size in the catalogue on your dimensions.
- Check the efficiency yourself: rated power divided by length times width, divided by ten. A shop figure that doesn't match is a cell efficiency, a typo or a different variant.
- Judge it against its technology, using the table above, rather than against the whole catalogue.
- On a roof that limits you, compare two specific modules in the panel comparison calculator with your own prices, and remember the format: on a small roof, one extra module fitting is usually worth more than a point of efficiency.
- Don't pay for efficiency to get more energy per kWp. You won't get it; look at the temperature coefficient for that.
What these figures can't tell you
Every catalogue figure is what a manufacturer printed, at standard test conditions, not our measurement. Counts are modules, not datasheets: one datasheet lists a ladder of power ratings, and each is a row, so a manufacturer with long ladders weighs more in every median and share. The worked area sums assume power scales with area at the rated figure and leave out frame-to-frame gaps and mounting rules. The price comparison covers one market, matched offers only, live when the page is served.
Figures and denominators
How the figures above were computed. Every figure is recomputed from the catalogue and the live shop offers when the page is served, and each one counts only the modules or offers that publish the value.
Catalogue figures cover the modules listed in our catalogue (the rankings view, which keeps only modules with a power rating and a page): 14,005 modules. Each is a row read from its manufacturer's datasheet, and one datasheet usually covers a ladder of power ratings, so a datasheet with eight ratings is eight modules here. Efficiency is the figure the datasheet prints, kept when it lies between 5 and 30 %; anything outside is an extraction error, not a claim.
The shares count modules at or above 21, 22 and 23 % out of every module with an efficiency in that range. A module belongs to a cell technology when its datasheet names it; modules labelled only "N-type" form their own group. Size classes use the module's outer area, length times width with the frame, for modules whose length lies between 500 and 3000 mm and width between 300 and 1500 mm.
The price comparison uses live Polish shop offers for single modules of 400 to 800 W that our matcher tied to one catalogue module by its part number, so the efficiency is the catalogue's. Prices are before VAT, in euro per watt at the day's ECB rate. For each Polish shop listing matched modules of both 21.5 to 23.5 % and 23.5 % and up, I take its median price per watt on each side and compare the two.
All 38 figures on this page and what each counts
| Figure | Value | Computed over |
|---|---|---|
| Module efficiency, median | 21.8 % | 13,998 modules |
| Module efficiency, 10th percentile | 19.6 % | 13,998 modules |
| Module efficiency, 90th percentile | 23.2 % | 13,998 modules |
| Modules whose efficiency equals power over area within 0.1 point | 13,426 | 14,005 modules |
| Modules with efficiency, power and dimensions | 13,983 | 14,005 modules |
| Rated power per square metre, median | 218 W/m² | 13,990 modules |
| Share of modules with a module efficiency of 21 % or more | 71 % | 13,998 modules |
| Share of modules with a module efficiency of 22 % or more | 48 % | 13,998 modules |
| Share of modules with a module efficiency of 23 % or more | 16 % | 13,998 modules |
| PERC: modules in the catalogue | 4,306 | 14,005 modules |
| PERC: module efficiency, median | 20.7 % | 4,306 modules |
| PERC: module efficiency, 10th percentile | 19.1 % | 4,306 modules |
| PERC: module efficiency, 90th percentile | 21.5 % | 4,306 modules |
| PERC: share with a module efficiency of 22 % or more | 1 % | 4,306 modules |
| TOPCon: modules in the catalogue | 5,733 | 14,005 modules |
| TOPCon: module efficiency, median | 22.5 % | 5,733 modules |
| TOPCon: module efficiency, 10th percentile | 21.5 % | 5,733 modules |
| TOPCon: module efficiency, 90th percentile | 23.3 % | 5,733 modules |
| TOPCon: share with a module efficiency of 22 % or more | 77 % | 5,733 modules |
| HJT: modules in the catalogue | 697 | 14,005 modules |
| HJT: module efficiency, median | 22.6 % | 697 modules |
| HJT: module efficiency, 10th percentile | 21.1 % | 697 modules |
| HJT: module efficiency, 90th percentile | 23.4 % | 697 modules |
| HJT: share with a module efficiency of 22 % or more | 78 % | 697 modules |
| Back Contact: modules in the catalogue | 440 | 14,005 modules |
| Back Contact: module efficiency, median | 23.6 % | 440 modules |
| Back Contact: module efficiency, 10th percentile | 22.3 % | 440 modules |
| Back Contact: module efficiency, 90th percentile | 24.5 % | 440 modules |
| Back Contact: share with a module efficiency of 22 % or more | 93 % | 440 modules |
| N-type: modules in the catalogue | 1,656 | 14,005 modules |
| N-type: module efficiency, median | 22.5 % | 1,656 modules |
| N-type: module efficiency, 10th percentile | 21.3 % | 1,656 modules |
| N-type: module efficiency, 90th percentile | 23.5 % | 1,656 modules |
| N-type: share with a module efficiency of 22 % or more | 76 % | 1,656 modules |
| Polish shops listing matched modules of both 21.5 to 23.5 % and 23.5 % and up | 13 | 13 shops |
| Of those, shops whose 23.5 % and up median price per watt is higher | 11 | 13 shops |
| Same shop, 23.5 % and up against 21.5 to 23.5 %, price per watt difference, median | 6 % | 13 shops |
| Modules in the catalogue | 14,005 | 14,005 modules |
Related tools
Reference list
- IEC 60904-3:2019, Photovoltaic devices, Part 3, Measurement principles for terrestrial PV solar devices with reference spectral irradiance data
- PVEducation, Solar cell efficiency (definition and test conditions)
- National Laboratory of the Rockies (NLR, formerly NREL), Champion Module Efficiencies chart
- Fraunhofer ISE, Photovoltaics Report, 14 July 2026, executive summary and commercial module efficiencies