
Buying
How to choose panels for a hot climate
Temperature coefficient or NOCT in the hottest hour of the day, with a worked example, catalogue spreads and what a better coefficient costs in shops.
In short: compare the Pmax temperature coefficient first, then how the module will be mounted, and treat small NOCT differences as noise, because they are often smaller than the error in measuring NOCT. In a hot hour with every NOCT held at 45 °C, the catalogue's modules deliver from 86.9 % to 89.8 % of their rating; with every coefficient held at -0.30 %/°C, from 89.1 % to 90.2 %. The wider of those two ranges belongs to the figure that tells modules apart more.
A module's rated power is measured with its cells at 25 °C. In summer sun they run well above that, and every degree costs output. Two datasheet figures describe how much: the temperature coefficient says how much power goes per degree, and the NOCT says how hot the cells get.
What heat costs, and what the data can't answer
The sunniest hours are also the hours with the hottest cells. So heat takes its share from exactly the output you're paying for.
Buyers in hot places usually ask about three things: the temperature coefficient, the NOCT and how the module behaves in weak light. The catalogue has no comparable low-light figure, such as efficiency at 200 W/m², so I cover the first two and leave weak light out rather than guess.


How the hot hour is calculated
Of the 14,005 modules in the catalogue, 12,850 state both a Pmax temperature coefficient and a NOCT. Each went through one hot hour, the example the heat yield comparison opens with: 30 °C air and 1000 W/m² of sunlight, on an open rack.
There are two steps, both from PVEducation. First the cell temperature: NOCT is what the cells reach at 800 W/m² of sunlight, 20 °C air and a 1 m/s wind with the back of the module open, and their rise above the air scales with the sunlight. Then the output: the rated power, reduced by the coefficient for every degree above 25 °C. The exact formulas and filters are under "Figures and denominators" below the article.
Heat losses by temperature coefficient and NOCT
A worked example at 30 °C air
Take a module with a NOCT of 45 °C. In the hot hour its cells reach 30 + (45 - 20) / 80 × 100 = 30 + 31.25 = 61.25 °C. That's 36.25 degrees above the rating condition.
Now give the same 450 W module two different coefficients and keep everything else equal. The last column is what you get:
| Coefficient | Loss at 61.25 °C | Output of a 450 W module |
|---|---|---|
| -0.35 %/°C | 36.25 × 0.35 = 12.7 % | 450 × 0.873 = 392.9 W |
| -0.26 %/°C | 36.25 × 0.26 = 9.4 % | 450 × 0.906 = 407.6 W |
The coefficient alone is worth about 15 W here, or 3 % of the rating.
Then the other lever. Hold the coefficient at -0.30 %/°C and lower the NOCT from 45 to 42 °C. The cells reach 57.5 °C instead of 61.25 °C, the loss falls from 10.9 % to 9.75 %, and output rises by about 1.1 % of the rating. In this example, three degrees of NOCT buy about a third of what the coefficient gap buys.
The figure below lets you move both levers, along with the air temperature and the sunlight.
What a hot roof does to two modules
Set the air temperature and the sunlight, give two modules their datasheet figures, and watch the cells heat up and the output bars move apart.
How this is computed
Cell temperature follows the NOCT method: Tcell = Tair + (NOCT - 20) / 800 × G, with G the sunlight on the module in W/m². NOCT is measured at 800 W/m², 20 °C air, 1 m/s wind and an open back, so the rise above the air is scaled from that test.
Output is the rating scaled by sunlight and by temperature: P = rating × G / 1000 × (1 + coefficient / 100 × (Tcell - 25)). It is the same calculation as the heat yield comparison tool, run once for each module.
The sentence under the readout splits the gap in two: B's output with A's coefficient at B's own cell temperature separates what the coefficient did from what the cooler or hotter cells did.
The model is a steady state with NOCT wind. A roof-mounted module with little air behind it runs hotter than its NOCT suggests, and wind cools it. It ignores weak-light losses, the spectrum, dirt and the inverter, and treats the coefficient as a straight line, which datasheets only state around 25 °C. It compares two modules under the same conditions; it is not a yield forecast.
Illustrative model, not a measurement.
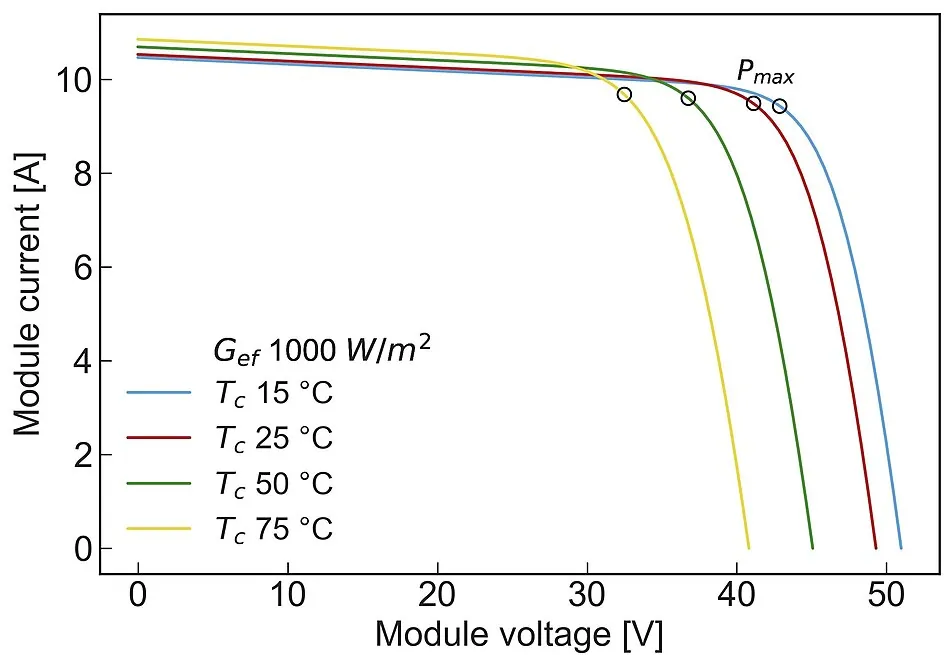
Heat costs power because it costs voltage. A hotter cell gives a lower voltage while its current rises only slightly, so the maximum power point slides down. The curves below show that shift for one module at four cell temperatures.

Across the catalogue
The example used round numbers. This is the spread you're actually choosing from; the two percentile columns bracket the middle eight in ten modules.
| Figure | Median | 10th percentile | 90th percentile |
|---|---|---|---|
| Coefficient (%/°C) | -0.30 | -0.36 | -0.28 |
| NOCT (°C) | 45 | 42 | 45 |
Of the stated NOCTs, 50 % are exactly 45 °C, the value the first row of the next table holds fixed.
In the hot hour the median module delivers 89.4 % of its rating, and the middle eight in ten fall between 87.3 % and 90.6 %. To see which input drives that range, the next table holds one fixed and lets the other vary. Compare the widths of the two rows: each is how far that figure alone separates real modules.
| Held fixed | Varies | 10th percentile | 90th percentile |
|---|---|---|---|
| NOCT at 45 °C | Coefficient | 86.9 % | 89.8 % |
| Coefficient at -0.30 %/°C | NOCT | 89.1 % | 90.2 % |
By cell technology
Here is the same hot hour grouped by cell technology: each group's median coefficient, median cell temperature and median output as a share of the rating. Back contact means cells with all their contacts on the rear face. Read down the cell column first. Where it barely moves from row to row, the output column is following the coefficient.
| Technology | Modules | Coefficient (%/°C) | Cell (°C) | Output (%) |
|---|---|---|---|---|
| PERC | 4,203 | -0.35 | 61 | 87.7 |
| TOPCon | 5,096 | -0.29 | 60 | 89.8 |
| N-type | 1,500 | -0.29 | 61 | 89.5 |
| Back contact | 284 | -0.26 | 61 | 90.6 |
| HJT | 690 | -0.24 | 60 | 91.6 |
The coefficients behind that table, across every module that states one, are below. Our article on cell technology and the temperature coefficient breaks them down by technology.
The numbers behind the chart
| Temperature coefficient of Pmax (%/°C) | Modules |
|---|---|
| <-0.40 | 191 |
| -0.40 to -0.38 | 255 |
| -0.38 to -0.36 | 434 |
| -0.36 to -0.34 | 2,713 |
| -0.34 to -0.32 | 1,822 |
| -0.32 to -0.30 | 504 |
| -0.30 to -0.28 | 5,845 |
| -0.28 to -0.26 | 880 |
| -0.26 to -0.24 | 824 |
| -0.24+ | 455 |
Does the straight-line model hold?
The calculation treats the coefficient as a straight line. Many datasheets let you test that, because they print the module's power at NOCT conditions, measured or calculated by the manufacturer. Set against what the coefficient predicts at the same conditions, the median module's stated power differs by 0.1 %, and the middle eight in ten sit between -1.0 % and 1.3 %.
A small gap proves less than it seems. Where a manufacturer calculated its power at NOCT from the coefficient instead of measuring it, the two agree by construction. And 800 W/m² is still strong sunlight, so the check says nothing about weak light.
What a better coefficient costs
The price figures come from Poland, the market that had matched offers in every coefficient band when this was written. The table gives the median price per watt for single modules our matcher links to a catalogue module, before VAT and in euro, grouped by that module's coefficient.
| Coefficient | Offers | Shops | EUR/W |
|---|---|---|---|
| below -0.32 %/°C | 39 | 12 | 0.196 |
| -0.32 to -0.29 %/°C | 169 | 27 | 0.141 |
| -0.28 %/°C and better | 143 | 20 | 0.146 |
Don't read the last column as the price of heat tolerance. Each band holds a different mix of modules and shops, and its median says as much about that mix as about the coefficient.
The fairer test is inside one shop, where the shop's own price level drops out. Of the 19 Polish shops that list matched modules in both of the two better bands, 12 charge more per watt for the better coefficient. Across all of them the median difference is 4 %.
What this means when you buy
Compare the temperature coefficient first
13,923 of the 14,005 modules in the catalogue state it, in the same unit, so you can line candidates up on it. The held-fixed table above shows how far it moves hot-hour output next to the NOCT.
Treat small NOCT differences as noise
PVEducation notes that most modules have a similar NOCT, around 40 to 45 °C, and that measuring it usually carries more uncertainty than the variation between modules. So a module with a NOCT two degrees lower isn't reliably a cooler module. I wouldn't let it decide between two otherwise equal panels.
Ask about the mounting before paying for a better coefficient
NOCT is measured with the back of the module open to the air. PVEducation gives roof-integrated mounting, with no air gap behind the module, as often adding 10 °C or more. At -0.30 %/°C, ten degrees cost 10 × 0.30 = 3 % of the rating; set that against the widths of the two held rows above. In a hot climate, the air gap behind the modules is the first thing I'd ask an installer about.
Weigh the price against your climate
The same-shop figures above show what a better coefficient costs. Whether it pays back depends on how many hours your cells actually run hot, and that's a question of your climate, not of the datasheet. The heat yield comparison puts two modules side by side at the air temperature and sunlight you choose, and the panel comparison calculator turns offer prices into a 30-year cost per kWh.
Check the voltage at the hot end too
Heat lowers a module's open-circuit voltage most of all, PVEducation notes, and voltage is what an inverter's window is sized against. The cold end of the year sets the highest voltage. The hot end sets the lowest, and that one must still sit inside the inverter's tracking range. Our article on Voc, Isc and inverter limits puts numbers on both ends.
Example modules and live prices
The shortlist below picks the modules with the smallest Pmax temperature coefficient, by the rule in its caption:
Top 3 by the smallest Pmax temperature coefficient, one module per datasheet, among 12,632 modules of 300 W or more with a stated cell technology and a stated Pmax temperature coefficient, as of the last catalogue sync.
Scorecard for this module: open its page on ComparePV.
Scorecard for this module: open its page on ComparePV.
Scorecard for this module: open its page on ComparePV.
When this was written, the module below had the most shop offers among those with a coefficient of -0.28 %/°C or better. These are its five lowest offers, ordered by price before VAT:
Cheapest current offers for Longi Solar LR7-60HVH-540M, prices read 9 Oct 2026.
| Shop | Market | Price | Availability |
|---|---|---|---|
| PV Zenit | Poland | 400.00 zł incl. VAT | In stock |
| Panele-Sloneczne.com | Poland | 340.26 zł net | In stock |
| Eco System Projekt | Poland | 445.00 zł incl. VAT | In stock |
| TIM SA | Poland | 471.71 zł incl. VAT | In stock |
| www.hlumar.sk | Slovakia | 110.00 € incl. VAT | In stock |
Each price is the figure the shop printed, on its own side of VAT.
What this analysis does not tell you
Every figure here is a manufacturer's claim, measured on sample modules under controlled conditions. None of it is a field result, and we haven't tested any module ourselves.
The hot hour is one steady condition: no passing clouds, no thermal mass, one wind speed, no inverter, no soiling. It isolates the effect of heat; it isn't a yield forecast. STC power versus what you actually get runs the same model at five other hours and adds PVGIS's yearly loss to temperature and irradiance for three cities.
The price comparison covers one market and only the offers our matcher could link to a catalogue module. Prices change daily; the figures here are as of the last pull.
Figures and denominators
How the figures above were computed. Every figure is recomputed from the catalogue and the live shop offers when the page is served, and each one counts only the modules or offers that publish the value.
The catalogue figures cover every listable module, 14,005 of them, as each manufacturer's datasheet states it. A module counts toward the hot-hour figures when its datasheet states a Pmax temperature coefficient between -1 and 0 %/°C and a NOCT between 35 and 55 °C; values outside those ranges are data entry errors, not datasheet claims.
The hot hour is the heat yield comparison tool's own example: 30 °C air, 1000 W/m² of sunlight on the module, an open rack. Cell temperature follows the NOCT formula from PVEducation, air temperature plus (NOCT - 20) / 80 times the sunlight in mW/cm². Output is the rated power scaled by sunlight over 1000 W/m² and by one plus the coefficient times the degrees above 25 °C. The two "held" variants repeat the calculation with NOCT fixed at 45 °C, or with the coefficient fixed at -0.30 %/°C, so that only the other input varies between modules.
The check against the datasheet's own power at NOCT divides the stated power at NOCT by the rated power, then by what the coefficient predicts at NOCT conditions: 0.8 of the rating, times one plus the coefficient times the NOCT minus 25 °C.
The price figures are live shop offers in Poland, the one market with enough matched offers in every band, for single modules of 400 to 800 W that our matcher links to a catalogue module, so the coefficient is the catalogue's. Prices are before VAT, in euro at the day's ECB reference rate. The same-shop comparison takes each Polish shop's median price per watt for modules of -0.28 %/°C and better against its median for -0.32 to -0.29 %/°C, for the shops that list both.
All 23 figures on this page and what each counts
| Figure | Value | Computed over |
|---|---|---|
| Hot hour (30 °C air, 1000 W/m²): output with NOCT held at 45 °C, 10th percentile | 86.9 % | 12,850 modules |
| Hot hour (30 °C air, 1000 W/m²): output with NOCT held at 45 °C, 90th percentile | 89.8 % | 12,850 modules |
| Hot hour (30 °C air, 1000 W/m²): output with the coefficient held at -0.30 %/°C, 10th percentile | 89.1 % | 12,850 modules |
| Hot hour (30 °C air, 1000 W/m²): output with the coefficient held at -0.30 %/°C, 90th percentile | 90.2 % | 12,850 modules |
| Modules in the catalogue | 14,005 | 14,005 modules |
| Modules stating both a Pmax coefficient and a NOCT | 12,850 | 14,005 modules |
| Temperature coefficient of Pmax, median | -0.30 %/°C | 13,923 modules |
| Temperature coefficient of Pmax, 10th percentile | -0.36 %/°C | 13,923 modules |
| Temperature coefficient of Pmax, 90th percentile | -0.28 %/°C | 13,923 modules |
| Nominal operating cell temperature, median | 45 °C | 12,877 modules |
| Nominal operating cell temperature, 10th percentile | 42 °C | 12,877 modules |
| Nominal operating cell temperature, 90th percentile | 45 °C | 12,877 modules |
| Share of stated NOCT values that are exactly 45 °C | 50 % | 12,877 modules |
| Hot hour (30 °C air, 1000 W/m²): output as a share of the rating, median | 89.4 % | 12,850 modules |
| Hot hour (30 °C air, 1000 W/m²): output as a share of the rating, 10th percentile | 87.3 % | 12,850 modules |
| Hot hour (30 °C air, 1000 W/m²): output as a share of the rating, 90th percentile | 90.6 % | 12,850 modules |
| Stated power at NOCT against the coefficient's prediction, median | 0.1 % | 10,004 modules |
| Stated power at NOCT against the coefficient's prediction, 10th percentile | -1.0 % | 10,004 modules |
| Stated power at NOCT against the coefficient's prediction, 90th percentile | 1.3 % | 10,004 modules |
| Polish shops listing matched modules of both -0.32 to -0.29 and -0.28 %/°C and better | 19 | 19 shops |
| Of those, shops whose -0.28 %/°C and better median price per watt is higher | 12 | 19 shops |
| Same shop, -0.28 %/°C and better against -0.32 to -0.29, price per watt difference, median | 4 % | 19 shops |
| Modules with a Pmax temperature coefficient | 13,923 | 13,923 modules |