
Buying
TOPCon or PERC when buying today?
TOPCon or PERC? Efficiency, heat losses, warranted ageing and price per watt compared across our module catalogue and live Polish shop offers.
In short: TOPCon changes the part of a PERC cell that limits it most, the metal contacts at the back, so on paper it should be more efficient and lose less in the heat. TOPCon modules in our catalogue state a median efficiency of 22.5 % and a temperature coefficient of -0.29 %/°C, PERC modules 20.7 % and -0.35 %/°C. Matched Polish offers have medians of 0.142 EUR/W for TOPCon and 0.189 EUR/W for PERC, and I'd buy PERC only where it's clearly cheaper per watt and the roof has room to spare.
PERC carried the market for years and TOPCon is its successor. Shops sell them side by side, and the datasheets look alike. Four differences cost or save you money: power per square metre, the share of it heat takes, the ageing the warranty allows, and price per watt. PERC is the baseline throughout; here is one of its cells from both sides.
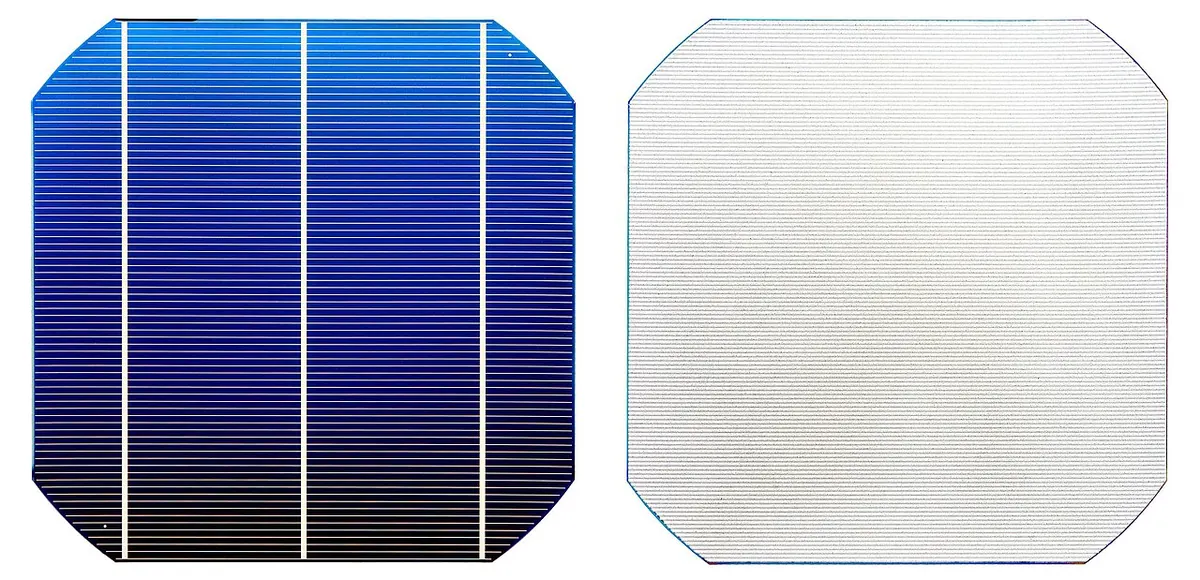
_front_and_back.jpg)
How the two groups were built
Our catalogue lists 5,733 modules as TOPCon and 4,306 as PERC. Another 1,656 say only "N-type" without naming the cell structure. Some of those may be TOPCon, but the datasheet doesn't say so, so I left them out of both groups.
Every catalogue figure here is what a manufacturer printed on a datasheet, for the whole article. None of it is a measurement.
Group medians have two traps. Each group mixes manufacturers in different proportions, and TOPCon is the newer technology, so its datasheets describe newer designs. That's why, next to the medians, I compare each manufacturer that lists both technologies with itself.
Prices come from the shop offers our crawler holds now. In Poland it holds 1,171 offers for single rooftop modules, and the matcher tied 351 of them to a catalogue module by part number. Only that tie tells us the cell, because a shop title rarely names it. The sanity ranges and the count behind each figure are in Figures and denominators, under the article.
The two example modules
Two modules carry the worked examples, picked by rule when I wrote this: the PERC and the TOPCon module with the most shop offers on their ComparePV pages, ties broken alphabetically. Both come from the same manufacturer, which keeps the brand out of the comparison. Nobody paid for a place.
The PERC example:
Scorecard for this module: open its page on ComparePV.
The TOPCon example:
Scorecard for this module: open its page on ComparePV.
TOPCon vs PERC: efficiency, heat, ageing and price
What is different inside the cell
The difference sits at the back of the cell, where the metal contacts meet the silicon. Feldmann and colleagues at Fraunhofer ISE, introducing the tunnel oxide passivated contact in 2013, describe high-efficiency cells as "often limited by the recombination at the metal semiconductor contacts". Recombination is charge lost before it reaches the wire.
A PERC cell still has metal touching silicon at every laser opening in its rear. TOPCon puts a thin oxide and a doped silicon layer between the two, the layer in the right-hand drawing below.
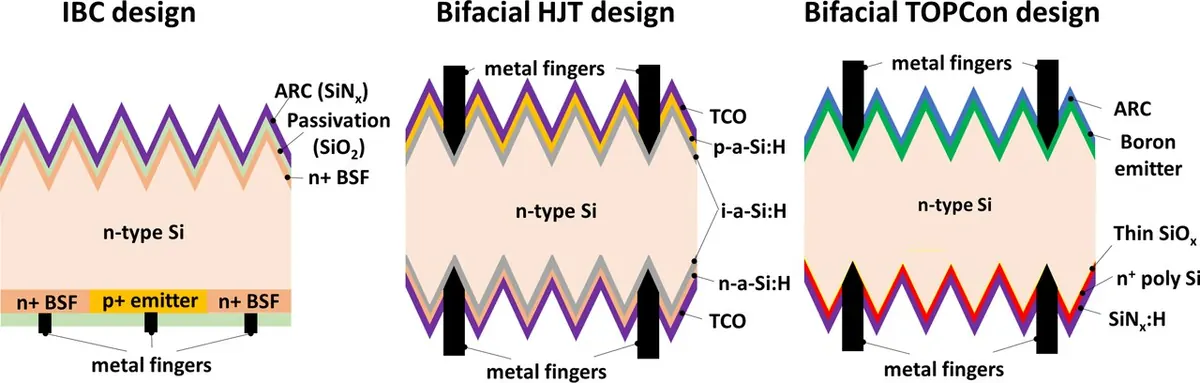
The figure below takes both cells apart layer by layer, with HJT as a third, and shows where the charge is lost.
Inside the cell: PERC, TOPCon and HJT
Switch between the three cells, select a layer to see what it does, and turn up the losses at the rear contact to see what happens to the voltage.
How this is computed
The drawing is a schematic cross-section, not to scale: the wafer is many times thicker than every other layer put together, and the thin films are drawn thick enough to select. The layer descriptions are textbook accounts of each structure as it is usually made; manufacturers vary the details.
Recombination at the rear contact is an ordinal scale from very low to very high, not a measurement. Each cell starts where its structure puts it: PERC high, because metal meets silicon at its rear openings; TOPCon low, because the tunnel oxide and poly-silicon sit between them; HJT very low, because amorphous silicon passivates both faces. The animation loses that many of its pairs at the rear as sparks.
Voc and heat loss are compared with a PERC cell as built, one arrow per step on the scale. The direction is textbook physics: Voc rises with the logarithm of the ratio of light-generated to recombination current, so less recombination raises it, and the share of Voc a cell loses per degree falls as Voc rises. The arrows give only a direction and an order. A real cell's voltage also depends on its wafer, front surface and emitter, which the slider leaves alone, so the figure stops being true as a way to rank two real modules: their datasheets do that.
Illustrative model, not a measurement.
Efficiency and heat losses
The temperature coefficient is the share of power lost per degree of cell temperature above 25 °C, so the figure closer to zero loses less on a hot roof. In the table, read the percentile row as well as the medians.
| Figure | TOPCon | PERC |
|---|---|---|
| Module efficiency, median | 22.5 % | 20.7 % |
| Efficiency, 10th to 90th percentile | 21.5 to 23.3 % | 19.1 to 21.5 % |
| Pmax temperature coefficient, median | -0.29 %/°C | -0.35 %/°C |
Hold the 90th percentile of PERC against the 10th percentile of TOPCon. If the first sits below the second, nine in ten modules of each group fall on their own side of the line. If they cross, single datasheets matter more than the label. 77 % of TOPCon modules state an efficiency of 22 % or more, against 1 % of PERC modules.
The two histograms share their efficiency bins. The groups differ in size, so compare the shapes rather than the bar heights.
The numbers behind the chart
| Module efficiency, TOPCon (%) | Modules |
|---|---|
| <17 | 127 |
| 17-18 | 13 |
| 18-19 | 32 |
| 19-20 | 28 |
| 20-21 | 106 |
| 21-22 | 1,036 |
| 22-23 | 3,122 |
| 23-24 | 1,170 |
| 24+ | 99 |
The numbers behind the chart
| Module efficiency, PERC (%) | Modules |
|---|---|
| <17 | 155 |
| 17-18 | 110 |
| 18-19 | 136 |
| 19-20 | 504 |
| 20-21 | 1,791 |
| 21-22 | 1,569 |
| 22-23 | 24 |
| 23-24 | 17 |
| 24+ | 0 |
The temperature coefficient article draws the same pair for heat losses.
Warranted ageing
The performance warranty states how much power a module may lose and stay in spec. Lower allowances and a higher end power are the better promise.
| Warranty figure | TOPCon | PERC |
|---|---|---|
| First-year degradation allowance | 1.0 % | 2.0 % |
| Annual degradation allowance | 0.40 %/yr | 0.55 %/yr |
| Performance warranty of 30 years or more | 91 % | 42 % |
| Power promised at warranty end | 87.4 % | 84.8 % |
There's a physical reason the first year can differ. The UNSW PV Manufacturing course names "the metastable boron-oxygen (BO) defect formation" as "the primary source" of carrier-induced degradation in boron-doped p-type wafers, a common base for PERC cells, and notes that gallium doping avoids it. TOPCon is usually built on n-type wafers. So where a TOPCon datasheet allows less for the first year, there is a cause behind it, though the allowance itself is a term the manufacturer chose.
The same manufacturer, both technologies
91 manufacturers list modules of both technologies, and comparing each with itself takes the brand out of the difference. Each row counts the manufacturers where TOPCon came out better, out of those that state the figure on both sides.
| Figure | TOPCon better | Manufacturers compared |
|---|---|---|
| Efficiency, higher median | 89 | 91 |
| Temperature coefficient, less loss per degree | 85 | 91 |
| Annual degradation allowance, lower | 71 | 77 |
The closer the first column comes to the second, the more the gap holds inside each brand. A first column near half the second would mean the medians above mostly reflect which brands sit in each group.
Product warranties split three ways: 50 manufacturers give both technologies the same median product warranty, 26 a longer one for TOPCon and 12 a shorter one. The warranty article explains what that term covers.
What they cost
The table gives euro per watt before tax for matched Polish offers. I kept prices to Poland because it held the most matched offers when I wrote this; the price per watt article covers every market. Read the middle half as well as the median, and check the offer and shop counts: a group resting on a few shops can see its median move with one price list.
| Group | Median (EUR/W) | Middle half (EUR/W) | Offers | Shops |
|---|---|---|---|---|
| TOPCon | 0.142 | 0.130 to 0.154 | 160 | 23 |
| PERC | 0.189 | 0.143 to 0.249 | 36 | 11 |
The offers cover 86 TOPCon and 28 PERC catalogue modules. Where the two middle halves don't overlap, three in four offers of one group are cheaper than three in four of the other. This is what a buyer meets in Polish shops; it says nothing about what either cell costs to make.
These are the cheapest current offers for the TOPCon example, each in the shop's own currency and on the side of VAT the shop printed:
Cheapest current offers for JA Solar JAM54D40-460/LB, prices read 9 Oct 2026.
| Shop | Market | Price | Availability |
|---|---|---|---|
| Megawat Elektrohurt | Poland | 321.03 zł incl. VAT | In stock |
| PV Zenit | Poland | 333.00 zł incl. VAT | In stock |
| Eco System Projekt | Poland | 350.00 zł incl. VAT | In stock |
Each price is the figure the shop printed, on its own side of VAT.
What it means when you buy
The arithmetic below uses the two example modules' datasheet figures, as our catalogue holds them.
More power from the same roof
The PERC module is rated 380 W on 1,769 by 1,052 mm, the TOPCon module 460 W on 1,762 by 1,134 mm. Divide the rating by the module area and you get power per square metre:
- PERC: 380 W / (1.769 m × 1.052 m) = 380 / 1.861 = 204.2 W/m²
- TOPCon: 460 W / (1.762 m × 1.134 m) = 460 / 1.998 = 230.2 W/m²
On 20 m² of usable roof that is 20 × 204.2 = 4.08 kW against 20 × 230.2 = 4.60 kW. The TOPCon roof carries 12.7 % more from the same area.
More of it left on a hot day
Heat widens the gap. With the cells at 65 °C, 40 degrees above the rating condition, the PERC module at -0.35 %/°C keeps 1 - 0.0035 × 40 = 86.0 % of its rating. The TOPCon module at -0.29 %/°C keeps 1 - 0.0029 × 40 = 88.4 %.
Per square metre that is 204.2 × 0.860 = 175.6 W against 230.2 × 0.884 = 203.5 W, now 15.9 % apart. The heat yield comparison runs the same sum for any two modules and any air temperature. Below it runs live, with a TOPCon median module as A and a PERC median module as B.
What a hot roof does to two modules
Set the air temperature and the sunlight, give two modules their datasheet figures, and watch the cells heat up and the output bars move apart.
How this is computed
Cell temperature follows the NOCT method: Tcell = Tair + (NOCT - 20) / 800 × G, with G the sunlight on the module in W/m². NOCT is measured at 800 W/m², 20 °C air, 1 m/s wind and an open back, so the rise above the air is scaled from that test.
Output is the rating scaled by sunlight and by temperature: P = rating × G / 1000 × (1 + coefficient / 100 × (Tcell - 25)). It is the same calculation as the heat yield comparison tool, run once for each module.
The sentence under the readout splits the gap in two: B's output with A's coefficient at B's own cell temperature separates what the coefficient did from what the cooler or hotter cells did.
The model is a steady state with NOCT wind. A roof-mounted module with little air behind it runs hotter than its NOCT suggests, and wind cools it. It ignores weak-light losses, the spectrum, dirt and the inverter, and treats the coefficient as a straight line, which datasheets only state around 25 °C. It compares two modules under the same conditions; it is not a yield forecast.
Illustrative model, not a measurement.
What each warranty promises
The PERC datasheet allows 2 % in the first year and 0.55 % a year after that, over 25 years: 100 - 2 - 0.55 × 24 = 84.8 % at year 25. The TOPCon datasheet allows 1 % and 0.40 % over 30 years: 100 - 1 - 0.40 × 24 = 89.4 % at year 25, and 100 - 1 - 0.40 × 29 = 87.4 % at year 30. That's what each manufacturer promises to make good, which is a different thing from how the module will age.
Checklist
If roof area limits the system, the efficiency gap is what you pay for. The roof-fit selector shows how much it adds on your roof.
If the roof has room to spare, price per watt decides. At an equal price the TOPCon example wins on area, heat and warranty, so a PERC offer has to be cheaper per watt to compete with it. I wouldn't pick PERC at an equal price.
Where the two spreads overlap, a well-specified PERC module can beat a weak TOPCon one, so compare the two you're actually considering in the panel comparison calculator.
What this comparison cannot tell you
The counts are modules, not datasheets. One datasheet usually lists a ladder of power ratings, several sizes of the same module, and each rating is its own catalogue row, so a manufacturer with long ladders weighs more in every median.
The worked examples assume power scales with area and temperature exactly as the coefficients say, and that warranty allowances run in a straight line. Real yield also depends on the inverter, shading and climate, none of which is in the sums.
The price comparison covers one market, only the offers the matcher could tie to the catalogue, and only those live when the page is served.
Figures and denominators
How the figures above were computed. Every figure is recomputed from the catalogue and the live shop offers when the page is served, and each one counts only the modules or offers that publish the value.
Catalogue figures are computed from the modules listed in our catalogue (the rankings view, which keeps only modules with a power rating and a page): 14,005 modules. Each is a row read from its manufacturer's datasheet, and one datasheet usually covers a ladder of power ratings, so a datasheet with eight ratings is eight modules here. A module counts as TOPCon or PERC when its datasheet names that cell technology; modules labelled only "N-type" are left out of both groups.
Each figure keeps only values in a sanity range: efficiency from 5 to 30 %, a Pmax temperature coefficient between -1 and 0 %/°C, annual degradation above 0 and below 2 % per year, a first-year allowance above 0 and below 5 %. A value outside the range is an extraction error, not a datasheet claim. The manufacturer comparison takes, for each manufacturer listing modules of both technologies, the median of each figure on each side, and counts a side only where it has a median.
Prices come from the shop offers our crawler holds now, one row per product page, kept for a week after the crawler last saw them. An offer counts when it is a single module of 400 to 800 W with a price before tax between 0.05 and 2 EUR per watt, converted to euro at the day's ECB rate. The TOPCon and PERC price comparison uses only Polish offers that our matcher tied to one catalogue module by its part number, since a shop title rarely names the cell.
All 31 figures on this page and what each counts
| Figure | Value | Computed over |
|---|---|---|
| TOPCon: module efficiency, median | 22.5 % | 5,733 modules |
| PERC: module efficiency, median | 20.7 % | 4,306 modules |
| TOPCon: modules in the catalogue | 5,733 | 14,005 modules |
| PERC: modules in the catalogue | 4,306 | 14,005 modules |
| N-type: modules in the catalogue | 1,656 | 14,005 modules |
| Poland: offers matched to a catalogue module | 351 | 1,171 offers |
| TOPCon: module efficiency, 10th percentile | 21.5 % | 5,733 modules |
| TOPCon: module efficiency, 90th percentile | 23.3 % | 5,733 modules |
| PERC: module efficiency, 10th percentile | 19.1 % | 4,306 modules |
| PERC: module efficiency, 90th percentile | 21.5 % | 4,306 modules |
| TOPCon: share with a module efficiency of 22 % or more | 77 % | 5,733 modules |
| PERC: share with a module efficiency of 22 % or more | 1 % | 4,306 modules |
| TOPCon: first-year degradation allowance, median | 1.0 % | 4,889 modules |
| PERC: first-year degradation allowance, median | 2.0 % | 3,459 modules |
| TOPCon: annual degradation, median | 0.40 %/yr | 4,937 modules |
| PERC: annual degradation, median | 0.55 %/yr | 3,356 modules |
| TOPCon: share with a performance warranty of 30 years or more | 91 % | 5,727 modules |
| PERC: share with a performance warranty of 30 years or more | 42 % | 4,263 modules |
| TOPCon: power at the end of the performance warranty, median | 87.4 % | 5,213 modules |
| PERC: power at the end of the performance warranty, median | 84.8 % | 3,706 modules |
| Manufacturers listing both TOPCon and PERC modules | 91 | 91 manufacturers |
| Manufacturers of both whose TOPCon median efficiency is higher than PERC | 89 | 91 manufacturers |
| Manufacturers of both stating efficiency on both sides | 91 | 91 manufacturers |
| Manufacturers of both whose TOPCon median Pmax coefficient is smaller in size than PERC | 85 | 91 manufacturers |
| Manufacturers of both stating a Pmax coefficient on both sides | 91 | 91 manufacturers |
| Manufacturers of both whose TOPCon median annual degradation is lower than PERC | 71 | 91 manufacturers |
| Manufacturers of both stating annual degradation on both sides | 77 | 91 manufacturers |
| Manufacturers of both whose TOPCon and PERC median product warranties are equal | 50 | 88 manufacturers |
| Manufacturers of both whose TOPCon median product warranty is longer than PERC | 26 | 88 manufacturers |
| Manufacturers of both whose TOPCon median product warranty is shorter than PERC | 12 | 88 manufacturers |
| Modules in the catalogue | 14,005 | 14,005 modules |