
Buying
How to read a solar panel datasheet
A field by field guide to the solar module datasheet, with typical values from our catalogue and three arithmetic checks that catch a figure that is wrong.
In short: read the Pmax temperature coefficient, the efficiency and the performance warranty first; most of the rest of the sheet is for the installer. Then run three sums that need only a calculator: power over area gives the efficiency, Vmp × Imp gives the rated power, and the degradation figures give the power the warranty promises at its end. In our catalogue the first sum holds for 13,426 of the 13,983 modules that state all three fields.
Who a solar panel datasheet is written for
A module datasheet is two pages that try to answer every question an installer, an inverter designer and a buyer might ask. Most of it isn't written for the person paying, which is fine once you know which lines are yours.
The tables below give, for each field, the catalogue median and the range that holds the middle eight in ten modules (the 10th to the 90th percentile). They come from 14,005 modules read from manufacturers' datasheets. A field counts only where the sheet states it and the value is plausible; the sanity ranges and the count behind each figure are under "Figures and denominators" at the end.
Two modules run through the article as examples. I picked them by a rule, not by brand: the two with the most shop offers in our live offers list when this was written, ties broken alphabetically. Nobody paid for a place.
The first is the JA Solar JAM54D40-470/LR, rated at 470 W.
Scorecard for this module: open its page on ComparePV.
The second is the LONGi LR7-60HVH-540M, rated at 540 W.
Scorecard for this module: open its page on ComparePV.
Typical values for each datasheet field
Most sheets group their fields in four blocks, in this order: electrical values, temperature behaviour, mechanical data and warranty.
Electrical values at standard test conditions
The first block is measured at standard test conditions (STC): 1000 W/m² of light with the AM1.5 spectrum and the cells at 25 °C. A real roof rarely holds those conditions for long, which is why the next block exists.
Of these four rows, the two to compare between modules are power and efficiency.
| Field | Median | 10th percentile | 90th percentile |
|---|---|---|---|
| Rated power (W) | 495 | 370 | 655 |
| Module efficiency (%) | 21.8 | 19.6 | 23.2 |
| Open-circuit voltage Voc (V) | 45.4 | 37.0 | 52.4 |
| Short-circuit current Isc (A) | 14.13 | 10.53 | 18.25 |
Module efficiency is the share of the light falling on the whole module, frame included, that comes out as electrical power. On a small roof it decides how much you can fit.
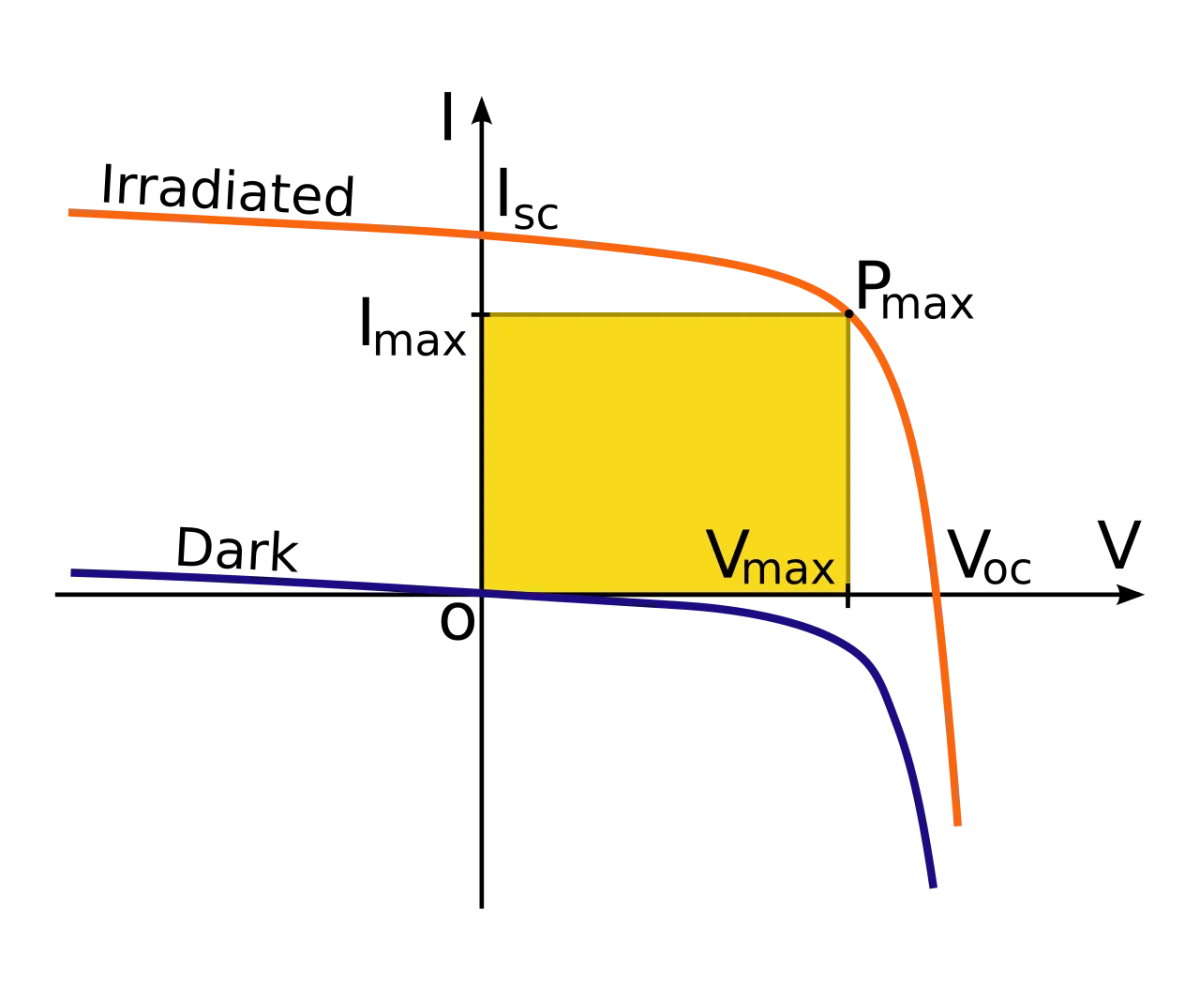
Voc and Isc are the two ends of the I-V curve, the line that shows the current a module delivers at each voltage. They size strings and cables, and their spread mostly follows cell count and wafer size. I wouldn't rank modules by them.
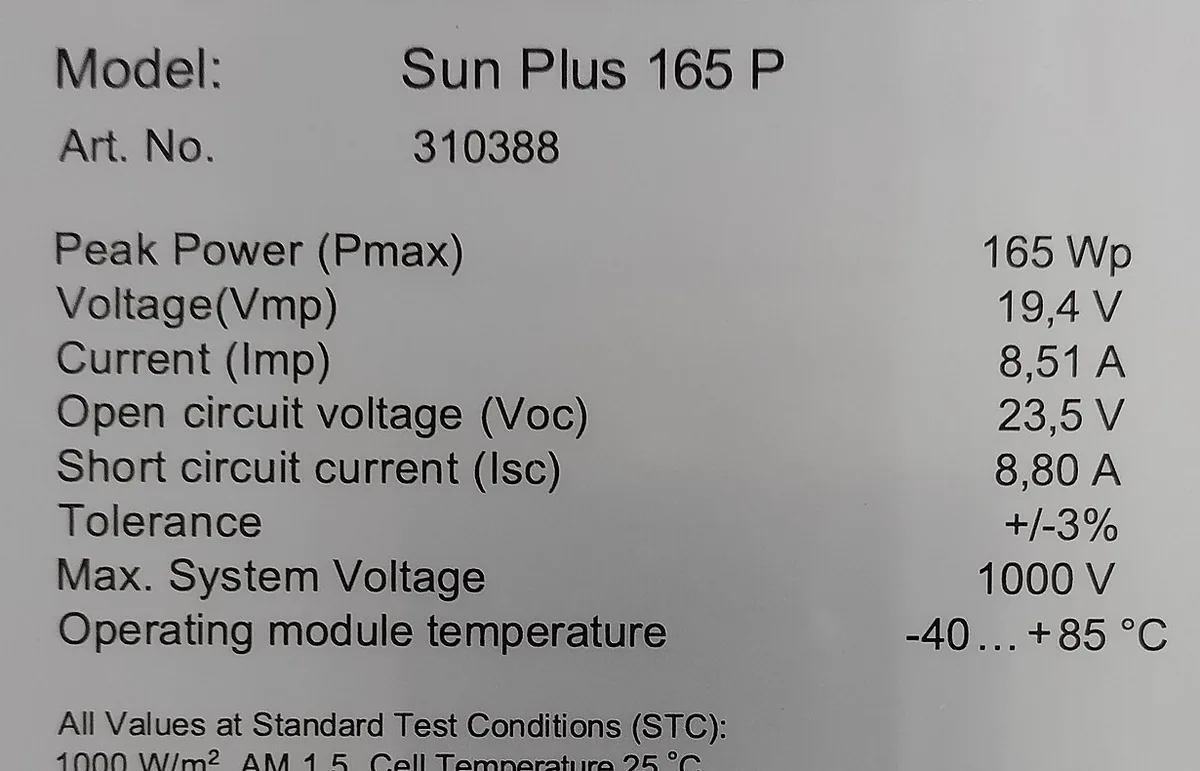
The rating plate on the back of the module repeats this block, all at STC. It's the quickest way to check that what arrived on the pallet is what the sheet describes.
.jpg)
The figure below draws those four numbers as one curve. Move the light and the cell temperature to see which of them follows which.
The I-V curve under real light and heat
Move the light and the cell temperature and watch the current, the power and the maximum power point move with them.
How this is computed
The curve is a single-diode model without series or shunt resistance, written in an explicit form that passes through the datasheet's three points: I(V) = Isc × (1 - C1 × (exp(V / (C2 × Voc)) - 1)), with C2 = (Vmp / Voc - 1) / ln(1 - Imp / Isc) and C1 = (1 - Imp / Isc) × exp(-Vmp / (C2 × Voc)).
For other conditions the four points move first and the curve is fitted through them again. With g the irradiance over 1000 W/m² and dT the cell temperature minus 25 °C: Isc and Imp scale by g × (1 + the Isc coefficient × dT); Voc changes by the Voc coefficient × dT; Vmp takes what the Pmax coefficient leaves after the current, so at 1000 W/m² the maximum power follows the datasheet's Pmax coefficient. Both voltages also drop by C2 × Voc × ln(g), the diode's own response to less current.
The model has no series resistance, so the curve's knee is sharper than a real module's, and no shunt, so weak light below about 200 W/m² reads a little optimistic. The temperature coefficients are straight lines around 25 °C. NOCT here is the cell temperature the datasheet states, used with 800 W/m²; the article explains how cells reach it.
Illustrative model, not a measurement.
Temperature coefficient and NOCT
The temperature coefficient of Pmax is the line in this block to read first. It says how much power the module loses for each degree its cells run above 25 °C, and on a summer roof they run well above it.
Compare the Pmax row between two modules: the figure closer to zero loses less in the heat.
| Field | Median | 10th percentile | 90th percentile |
|---|---|---|---|
| Pmax coefficient (%/°C) | -0.30 | -0.36 | -0.28 |
| Voc coefficient (%/°C) | -0.25 | -0.28 | -0.23 |
| NOCT (°C) | 45 | 42 | 45 |
The chart shows how the stated Pmax coefficient spreads across the catalogue.
The numbers behind the chart
| Temperature coefficient of Pmax (%/°C) | Modules |
|---|---|
| <-0.40 | 191 |
| -0.40 to -0.38 | 255 |
| -0.38 to -0.36 | 434 |
| -0.36 to -0.34 | 2,713 |
| -0.34 to -0.32 | 1,822 |
| -0.32 to -0.30 | 504 |
| -0.30 to -0.28 | 5,845 |
| -0.28 to -0.26 | 880 |
| -0.26 to -0.24 | 824 |
| -0.24+ | 455 |
The JA module states -0.29 %/°C. With its cells at 65 °C, 40 degrees above the test, it loses 40 × 0.29 = 11.6 %, so it makes 470 × 0.884 = about 415.5 W. The heat yield comparison runs the same sum for any two modules.
NOCT is the temperature the cells reach under 800 W/m² of light, 20 °C air and a 1 m/s wind with the back of the module open. A lower figure means a cooler-running module.
Some sheets also print the power at NOCT, which is closer to an ordinary sunny hour than STC is. 10,193 of the 14,005 modules state it. For the JA module it's 356 W, and 356 / 470 is about three quarters of the label.
Size, weight and load ratings
Length, width and weight decide whether the module fits your roof and whether the roof and mounting can carry it. The roof-fit selector does the fitting, and how big are modern solar panels shows how sizes spread across the catalogue.
Hand the load rows to your installer if your roof sees heavy snow or strong wind.
| Field | Median | 10th percentile | 90th percentile |
|---|---|---|---|
| Weight (kg) | 26.5 | 20.3 | 35.0 |
| Front static load (Pa) | 5,400 | 5,400 | 5,400 |
| Rear static load (Pa) | 2,400 | 2,400 | 4,000 |
Where a row prints the same value in all three columns, at least eight in ten modules state that one figure. On a load row that usually means a common test level, which separates one module from another very little.
The static load figures are the pressure on the front (snow and wind) and the uplift on the rear (wind) the module is rated for. A sheet may print the test load, which is higher than the load a structure may be designed for, and either figure holds only with the clamping the installation manual describes.
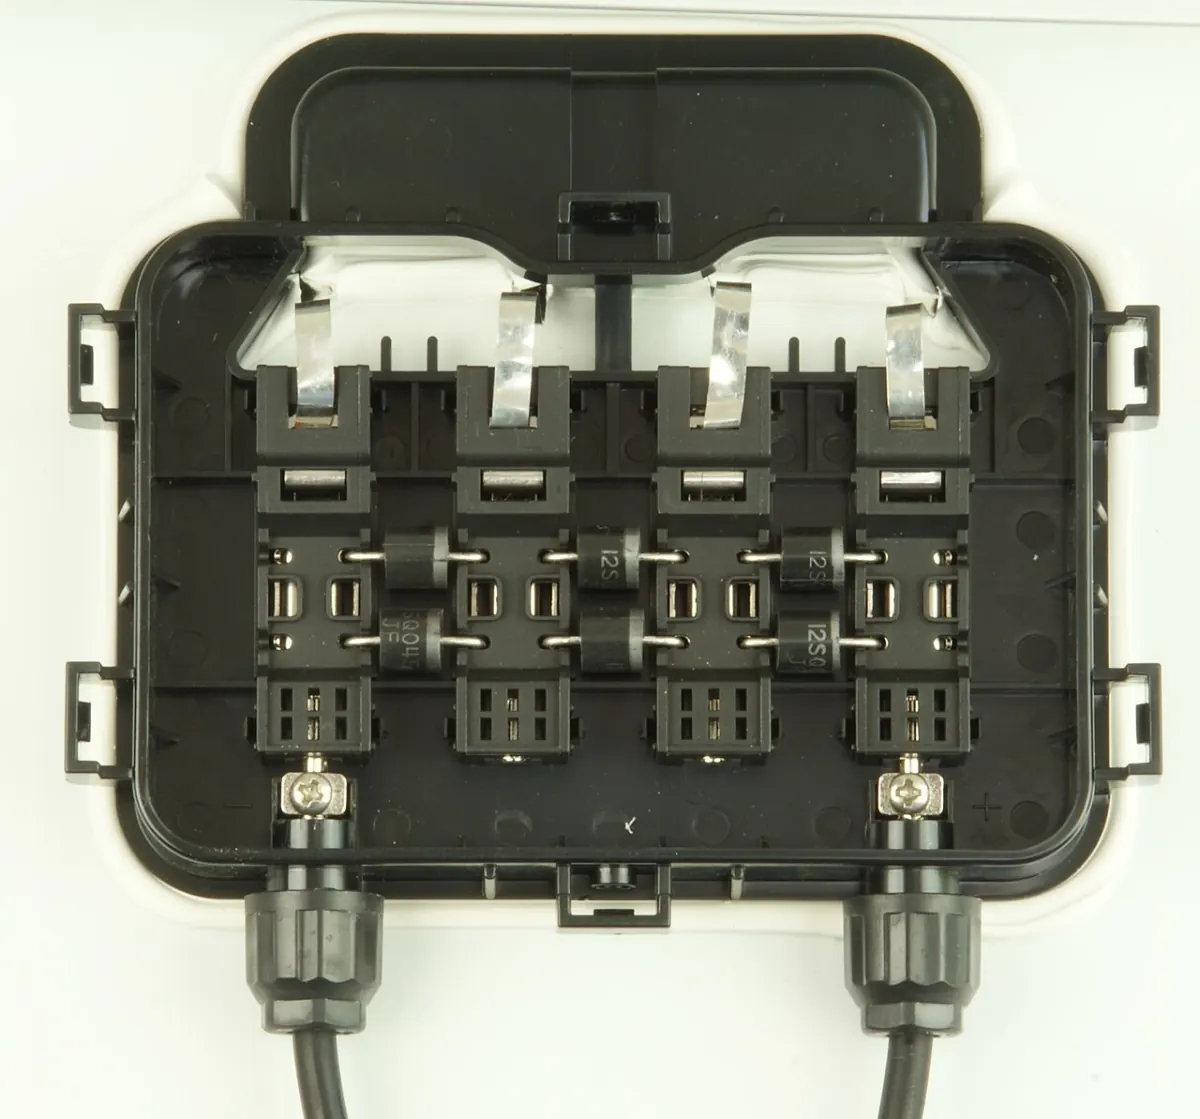
The same part of the sheet usually lists the junction box on the back: its ingress protection rating, the bypass diodes (which let current flow around a shaded or damaged group of cells), the cable length and the connector type. For a buyer these lines matter mostly when they're missing.

Warranty and degradation figures
Two warranties sit side by side. The product warranty covers defects in the module itself. The performance warranty promises a share of the rated power after a number of years, usually as a first-year allowance (which covers early losses such as LID) and then a fixed annual degradation.
Read the last four rows together. They describe one promise, and the third check below tests whether they agree.
| Field | Median | 10th percentile | 90th percentile |
|---|---|---|---|
| Product warranty (years) | 15 | 12 | 25 |
| Performance warranty (years) | 30 | 25 | 30 |
| Power at the end of it (%) | 87.4 | 83.1 | 88.8 |
| First-year degradation (%) | 1.0 | 1.0 | 2.5 |
| Annual degradation (% per year) | 0.40 | 0.35 | 0.55 |
11,535 of the 14,005 modules state a first-year allowance. Product warranty versus performance warranty compares the two warranties across the catalogue.
Three datasheet checks that need only arithmetic
Three fields can be recomputed from others, so you can check a sheet, or a shop's copy of it, in a minute on a phone.
Check 1: efficiency is power over area
PVEducation defines efficiency against an input of 1 kW/m². So efficiency = rated power / (length × width × 1000 W/m²). The JA module measures 1,762 × 1,134 mm and the LONGi module 1,990 × 1,134 mm.
The computed column should land on the printed one, give or take rounding.
| Module | Rated power (W) | Area (m²) | Computed (%) | Printed (%) |
|---|---|---|---|---|
| JA | 470 | 1.998 | 23.52 | 23.50 |
| LONGi | 540 | 2.257 | 23.93 | 23.90 |
Both pass. Across the catalogue the stated efficiency matches this sum within 0.1 point for 13,426 of the 13,983 modules that state all three fields.
Check 2: rated power is Vmp × Imp
The maximum power point is where voltage times current on the I-V curve is largest. Vmp and Imp are its voltage and current, so their product has to come back to the rated power. The drawing below marks it next to Isc and Voc.

Both example modules pass this one too.
| Module | Vmp (V) | Imp (A) | Vmp × Imp (W) | Rated (W) |
|---|---|---|---|---|
| JA | 33.84 | 13.89 | 470.0 | 470 |
| LONGi | 37.11 | 14.55 | 540.0 | 540 |
In our catalogue the product lands within 1 % of the label for 13,909 of 14,003 modules. The same four numbers give the fill factor, Vmp × Imp / (Voc × Isc), which PVEducation describes as the squareness of the curve.
Check 3: the warranty end follows from the degradation figures
A linear warranty loses the first-year allowance once and the annual rate in every year after. Over 30 years that is 100 minus the first-year figure minus 29 annual steps.
Here the two modules part ways, at least in our records when this was written.
| Module | First year (%) | Annual (% per year) | Computed end (%) | End in our records (%) |
|---|---|---|---|---|
| LONGi | 1 | 0.35 | 88.85 | 88.85 |
| JA | 1 | 0.4 | 87.4 | 83.1 |
LONGi checks out: 100 - 1 - 0.35 × 29 = 88.85 %, against 88.85 % in our records. In our catalogue the sum holds within 0.5 point for 10,432 of the 10,820 modules that state all four figures.
The JA module doesn't. Our records hold 1 % in the first year, 0.4 % a year and 83.1 % after 30 years, but 100 - 1 - 0.4 × 29 = 87.4 %. Working back from the end figure, 83.1 % would need (99 - 83.1) / 29 = 0.55 % a year.
The datasheet doesn't contradict itself; our record does. The manufacturer's sheet (version Global-EN-20250711A) states 1 % in the first year and 0.4 % a year, and its warranty chart marks 87.4 % at 30 years for this series. The 83.1 % on the same chart is the end of the line drawn for a standard module, and our record picked up that figure. The check alone can't say which number is wrong, only that both can't be right; here the sheet settles it. Until the record is corrected, the module's page shows what we hold.
What to read first when you buy
Start with the three fields that describe what the module delivers once it's installed: the Pmax temperature coefficient (power lost to heat), the efficiency (power per square metre of roof) and the performance warranty (power promised over time).
Voc, Isc and the load ratings decide whether the module may be used on a given roof and inverter at all. That's the installer's question, and our article on Voc, Isc and inverter limits covers what they're read against.
Compare at the same conditions. Every electrical figure in the first block is at STC, and a shop that quotes one module at STC and another at NOCT is comparing two different lights. The panel comparison calculator puts two catalogue modules on the same footing.
Run the three checks on anything you're about to buy. A failed check doesn't prove a bad module. It's a reason to ask the shop or the manufacturer which number is right.
Look for what's missing, too. A sheet without a degradation schedule or a temperature coefficient says nothing about ageing or heat loss, and the rating plate shows neither.
What these figures can't tell you
Every value here is a manufacturer's claim, measured on new modules in a laboratory, and our figures are our reading of those sheets rather than new measurements. None of it says how a module will perform on your roof. An unusual value can also be our misreading; the checks above are one way we find those.
Each power rating counts as its own module. One datasheet usually covers a ladder of power ratings, several wattages sharing one coefficient, warranty and size, so a manufacturer with long ladders weighs more in every median than one with short ones.
Power tolerance isn't in our catalogue. Power tolerance explains why a delivered module can sit a little above or below its rated power.
Figures and denominators
How the figures above were computed. Every figure is recomputed from the catalogue and the live shop offers when the page is served, and each one counts only the modules or offers that publish the value.
Every figure on this page is computed from the modules listed in our catalogue (the rankings view, which keeps only modules with a power rating and a page): 14,005 modules. Each one is a row read from its manufacturer's datasheet. One datasheet usually covers a ladder of power ratings, so a datasheet with eight ratings is eight modules here.
A field counts toward a median or percentile only when its value sits inside a sanity range: efficiency 5 to 30 %, Pmax coefficient between -1 and 0 %/°C, weight 1 to 100 kg, load ratings 1,000 to 20,000 Pa, product warranty 5 to 50 years, performance warranty 10 to 50 years, end-of-warranty power 50 to 100 %, first-year degradation above 0 and below 5 %, annual degradation above 0 and below 2 % per year. Outside those ranges a value is a unit slip or a misread column, not a claim. Percentiles are continuous percentiles over the modules in range; the denominator of each one is listed under the article.
The three checks run on every module that carries all the fields a check needs. Efficiency: rated power divided by the module area and by 1,000 W/m², within 0.1 percentage point of the stated efficiency. Power: Vmp times Imp within 1 % of the rated power. Warranty: 100 % minus the first-year allowance minus the annual rate times the remaining years, within 0.5 percentage point of the power the warranty promises at its end.
All 54 figures on this page and what each counts
| Figure | Value | Computed over |
|---|---|---|
| Modules whose efficiency equals power over area within 0.1 point | 13,426 | 14,005 modules |
| Modules with efficiency, power and dimensions | 13,983 | 14,005 modules |
| Modules in the catalogue | 14,005 | 14,005 modules |
| Rated power at STC, median | 495 W | 14,005 modules |
| Rated power at STC, 10th percentile | 370 W | 14,005 modules |
| Rated power at STC, 90th percentile | 655 W | 14,005 modules |
| Module efficiency, median | 21.8 % | 13,998 modules |
| Module efficiency, 10th percentile | 19.6 % | 13,998 modules |
| Module efficiency, 90th percentile | 23.2 % | 13,998 modules |
| Open-circuit voltage at STC, median | 45.4 V | 13,925 modules |
| Open-circuit voltage at STC, 10th percentile | 37.0 V | 13,925 modules |
| Open-circuit voltage at STC, 90th percentile | 52.4 V | 13,925 modules |
| Short-circuit current at STC, median | 14.13 A | 14,002 modules |
| Short-circuit current at STC, 10th percentile | 10.53 A | 14,002 modules |
| Short-circuit current at STC, 90th percentile | 18.25 A | 14,002 modules |
| Temperature coefficient of Pmax, median | -0.30 %/°C | 13,923 modules |
| Temperature coefficient of Pmax, 10th percentile | -0.36 %/°C | 13,923 modules |
| Temperature coefficient of Pmax, 90th percentile | -0.28 %/°C | 13,923 modules |
| Temperature coefficient of Voc, median | -0.25 %/°C | 13,929 modules |
| Temperature coefficient of Voc, 10th percentile | -0.28 %/°C | 13,929 modules |
| Temperature coefficient of Voc, 90th percentile | -0.23 %/°C | 13,929 modules |
| Nominal operating cell temperature, median | 45 °C | 12,877 modules |
| Nominal operating cell temperature, 10th percentile | 42 °C | 12,877 modules |
| Nominal operating cell temperature, 90th percentile | 45 °C | 12,877 modules |
| Modules stating power at NOCT | 10,193 | 14,005 modules |
| Module weight, median | 26.5 kg | 13,987 modules |
| Module weight, 10th percentile | 20.3 kg | 13,987 modules |
| Module weight, 90th percentile | 35.0 kg | 13,987 modules |
| Front (snow and wind) static load rating, median | 5,400 Pa | 12,969 modules |
| Front static load rating, 10th percentile | 5,400 Pa | 12,969 modules |
| Front static load rating, 90th percentile | 5,400 Pa | 12,969 modules |
| Rear (wind uplift) static load rating, median | 2,400 Pa | 12,678 modules |
| Rear static load rating, 10th percentile | 2,400 Pa | 12,678 modules |
| Rear static load rating, 90th percentile | 4,000 Pa | 12,678 modules |
| Product warranty, median | 15 years | 13,615 modules |
| Product warranty, 10th percentile | 12 years | 13,615 modules |
| Product warranty, 90th percentile | 25 years | 13,615 modules |
| Performance warranty, median | 30 years | 13,877 modules |
| Performance warranty, 10th percentile | 25 years | 13,877 modules |
| Performance warranty, 90th percentile | 30 years | 13,877 modules |
| Power promised at the end of the performance warranty, median | 87.4 % | 12,330 modules |
| Power promised at the end of the performance warranty, 10th percentile | 83.1 % | 12,330 modules |
| Power promised at the end of the performance warranty, 90th percentile | 88.8 % | 12,330 modules |
| First-year degradation allowance, median | 1.0 % | 11,535 modules |
| First-year degradation allowance, 10th percentile | 1.0 % | 11,535 modules |
| First-year degradation allowance, 90th percentile | 2.5 % | 11,535 modules |
| Annual degradation, median | 0.40 %/yr | 11,546 modules |
| Annual degradation, 10th percentile | 0.35 %/yr | 11,546 modules |
| Annual degradation, 90th percentile | 0.55 %/yr | 11,546 modules |
| Modules stating a first-year degradation allowance | 11,535 | 14,005 modules |
| Modules whose Vmp x Imp equals rated power within 1 % | 13,909 | 14,005 modules |
| Modules with Vmp and Imp | 14,003 | 14,005 modules |
| Modules whose warranty end power follows from the degradation figures within 0.5 point | 10,432 | 14,005 modules |
| Modules with both degradation figures and an end-of-warranty power | 10,820 | 14,005 modules |