
Buying
Voc, Isc and your inverter: reading voltage and current
Where Voc and Isc sit on a datasheet, how far cold raises the voltage and heat the current, and which inverter limits they are checked against.
In short: Voc is the voltage a module makes with nothing connected, Isc the current with its terminals shorted, both rated at a 25 °C cell. Cold pushes Voc up: at -10 °C the median module gains 8.8 %, and in a string every module in series gains it at once. Check the string's cold Voc against the inverter's maximum input voltage and its Isc against the current limits on each input, then let your installer do the actual sizing.
Every module datasheet prints two electrical figures the inverter cares about most: the open-circuit voltage, Voc, and the short-circuit current, Isc. Both are measured at standard test conditions, and both move with temperature.
I stop where the design work starts. Whether a given string on a given roof is safe is a calculation for your installer, and a catalogue can't make it for you.
Each figure below is a median or a percentile over the modules that state the value it needs. Two temperatures do the work: a cell at -10 °C, the example John Wiles uses in his IAEI column on PV system calculations, and the hot hour of the heat yield comparison, 30 °C air and full sun, with each module's cell temperature worked out from its NOCT. Neither is a design temperature for your site. The counting rules and the module count behind each number are under "Figures and denominators".
Voc and Isc on the datasheet
The median module states a Voc of 45.4 V and an Isc of 14.13 A. Datasheets also print a maximum series fuse rating, the largest fuse the module may be protected by. Read the right-hand column as the range the middle eight in ten modules fall in:
| Datasheet figure | Median | Middle eight in ten |
|---|---|---|
| Voc | 45.4 V | 37.0 to 52.4 V |
| Isc | 14.13 A | 10.53 to 18.25 A |
| Maximum series fuse | 30 A | 20 to 35 A |
Next to these sits the maximum system voltage the module's insulation is rated for. In the catalogue, 12,612 modules state 1500 V and 988 state 1000 V. The string voltage has to stay under it as well as under the inverter's limit.
Voltage and current by power class
A module gains power in two ways. More cells in series raise its voltage; bigger cells raise its current. Splitting the catalogue by rated power shows which one each class leans on. Read the Isc column top to bottom, then the Voc column, and see which of the two follows power:
| Power class | Modules | Voc, V | Isc, A | Isc × 1.25, A |
|---|---|---|---|---|
| under 400 W | 1,997 | 40.4 | 10.2 | 12.8 |
| 400-499 W | 5,013 | 39.6 | 14.0 | 17.5 |
| 500-599 W | 3,423 | 49.8 | 14.1 | 17.6 |
| 600-699 W | 2,726 | 49.1 | 16.1 | 20.1 |
| 700 W and up | 765 | 49.2 | 18.4 | 23.0 |
Each value is the class median. The last column is the figure many inverters ask for; it comes back in the inverter section.
The chart shows how Isc spreads across the whole catalogue. Tall bars mark the current values many datasheets share; the line marks the median.
The numbers behind the chart
| Short-circuit current at STC (A) | Modules |
|---|---|
| <10 | 993 |
| 10-11 | 661 |
| 11-12 | 763 |
| 12-13 | 208 |
| 13-14 | 3,402 |
| 14-15 | 3,518 |
| 15-16 | 1,574 |
| 16-17 | 821 |
| 17-18 | 413 |
| 18-19 | 1,609 |
| 19+ | 40 |
Cold mornings raise the voltage
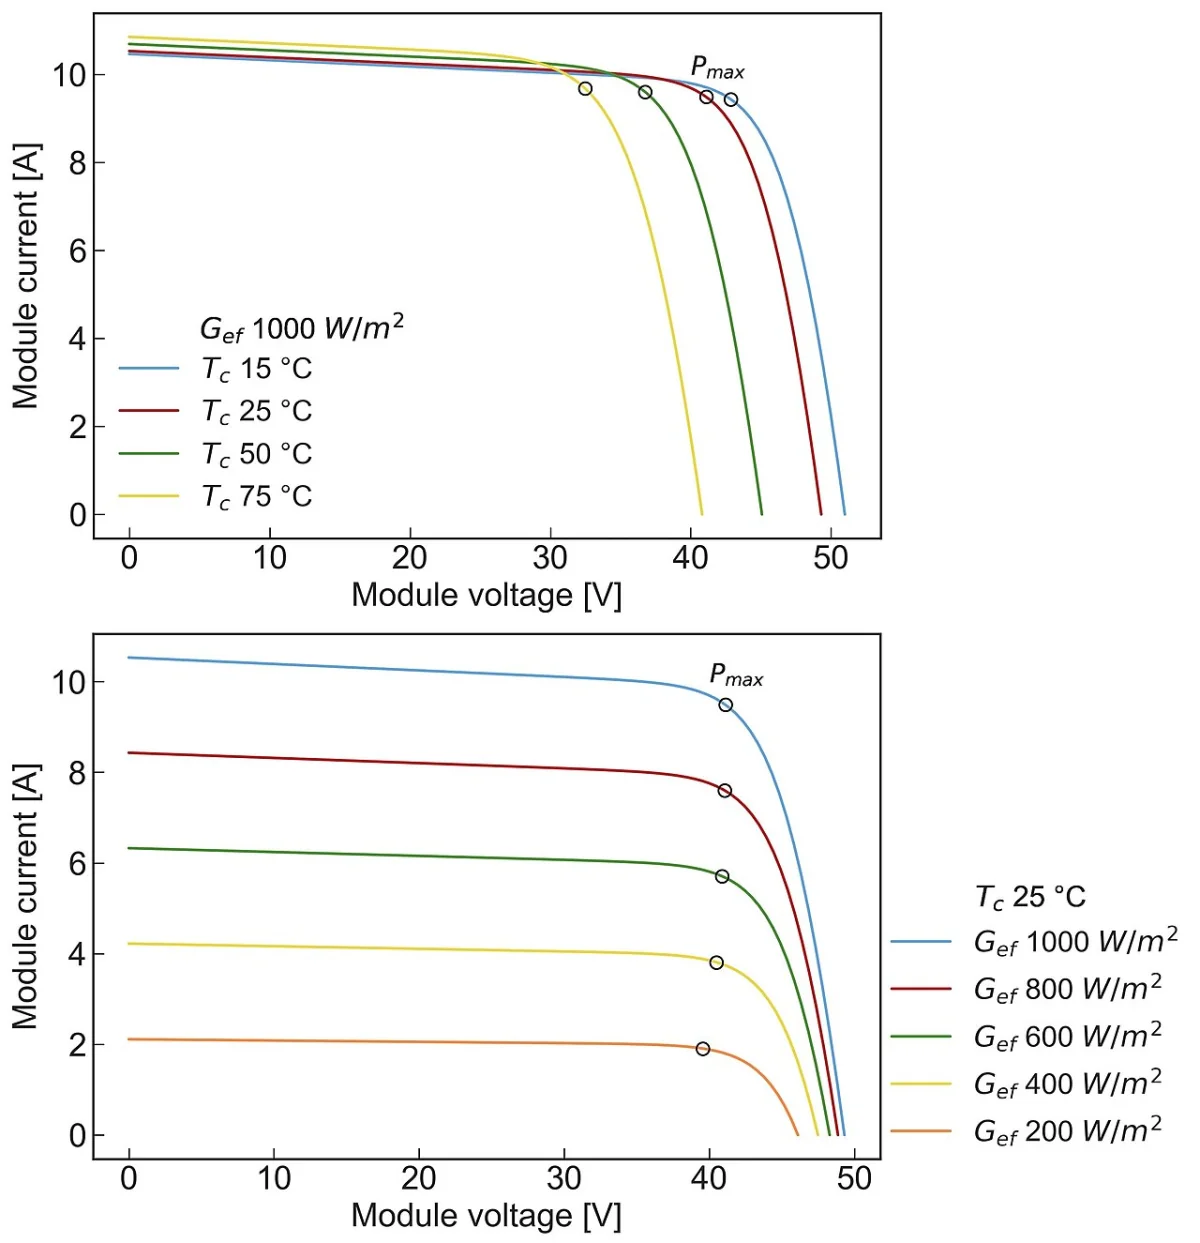
A cell's voltage rises as it cools. PVEducation names the open-circuit voltage as the parameter temperature affects most. The datasheet gives the rate as the Voc coefficient, the percentage Voc changes for each degree away from 25 °C. The median module states -0.25 %/°C, with eight in ten between -0.28 and -0.23 %/°C.
The drawing below shows the effect of temperature and irradiance on I-V curves, the plot of a module's current against its voltage.

A worked example
Wiles takes a module with a Voc of 45 V, a coefficient of -0.36 %/°C and a cell at -10 °C:
- The cell is 35 degrees below the rating's 25 °C.
- 35 × 0.36 % = 12.6 % more voltage.
- 45 V × 1.126 = 50.67 V.
Hold his -0.36 %/°C against the catalogue median above. Run the same -10 °C through each module's own coefficient and the median module's Voc rises 8.8 % above its rating, with eight in ten rising between 8.2 % and 10.0 %. In volts, the median module's cold Voc is 49.6 V, and one in ten goes above 56.9 V.
The string multiplies it
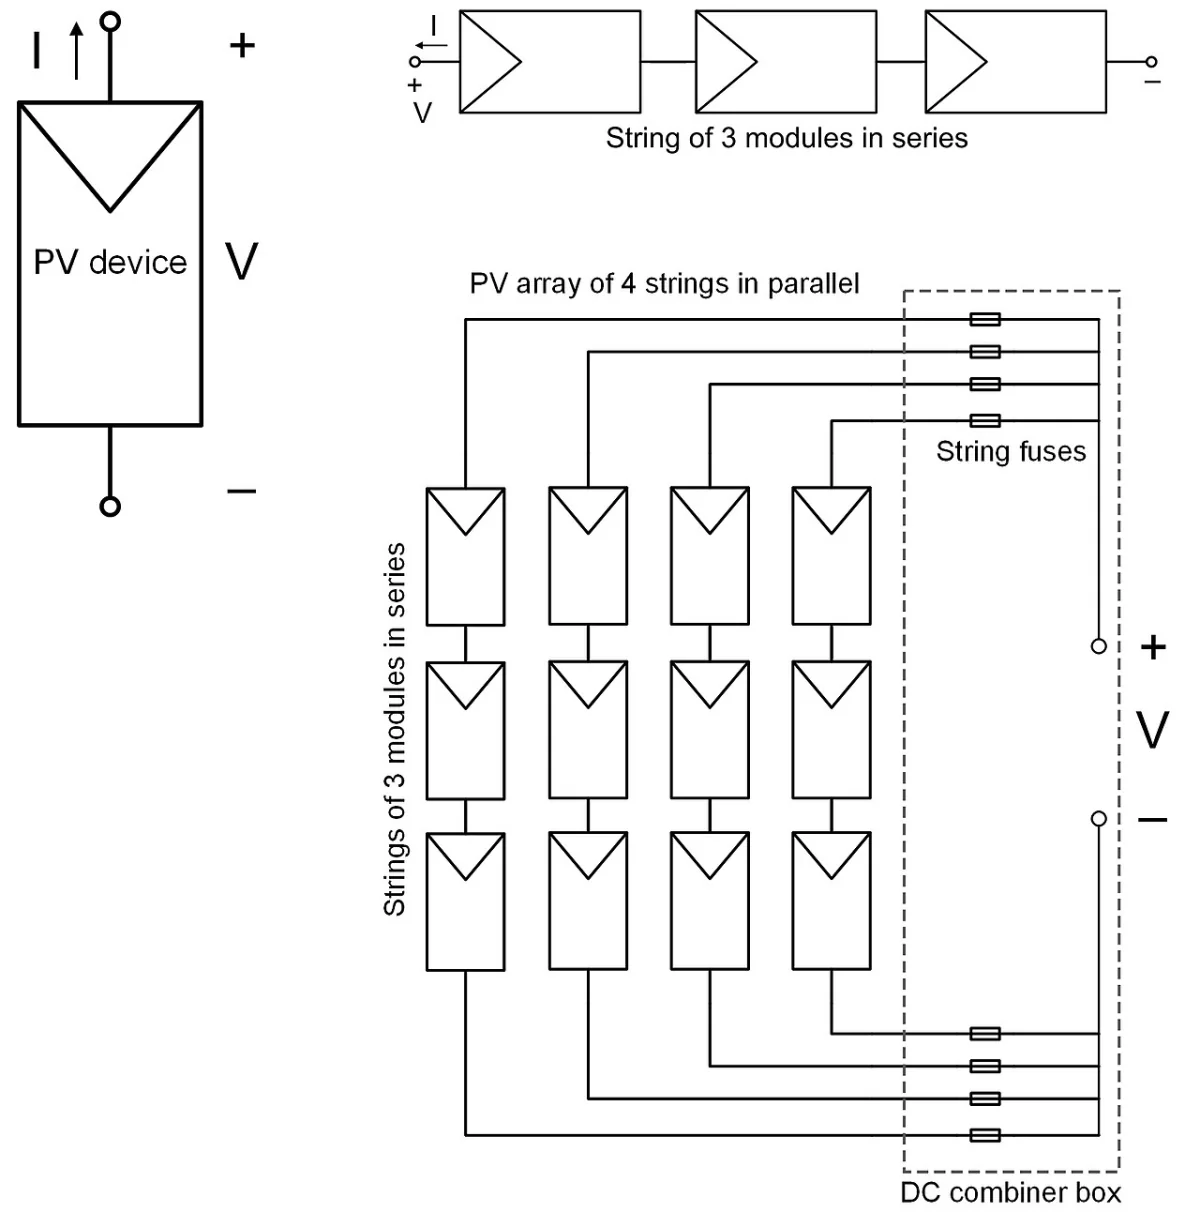
That rise is per module. Modules in a string are wired in series and their voltages add, so the same percentage lands on the whole string. Ten modules carry ten times the cold Voc of one.
Wiles notes that the lowest temperature usually comes in the early morning, just before sunrise on cold winter days. That hour is the one to design for, not the average winter afternoon.
The figure below puts a string against an inverter's input. Start with the coldest temperature and the number of modules, then move to the hot end.
Will the string fit the inverter?
Change the number of modules in series and the coldest and hottest cell temperatures, and watch the string's voltage move against the inverter's tracking window and its maximum input.
How this is computed
Each module's voltage moves in a straight line with cell temperature: Voc(T) = Voc at STC × (1 + Voc coefficient / 100 × (T - 25)), and the same for Vmp with its own coefficient. The string is the number of modules times one module. Cold Voc is checked against the maximum DC input, hot Vmp against the MPPT minimum and cold Vmp against the MPPT maximum.
The margin rule is the plain one: a voltage equal to a limit fits, and there is no hidden safety factor. Local electrical codes and the inverter's datasheet decide which temperature to design for and what margin to keep, and some codes use their own correction tables instead of the coefficient. Follow those, not this figure.
Datasheets rarely print a Vmp coefficient. The starting value is the catalogue median Pmax coefficient less the median Isc coefficient, the usual stand-in, and a loaded module gets the same from its own datasheet. A temperature coefficient read as positive is taken for a dropped minus sign, because silicon's voltage always falls as it warms.
The model is one string on one input, at first light on the cold morning for Voc and in full sun for Vmp. It ignores cable losses, shading, mismatch between modules and the inverter's current limits, which the article covers separately. It is an illustration, not a string design.
Illustrative model, not a measurement.
Heat lowers the voltage and nudges the current up
In the hot hour the median module's Voc falls 9.1 % below its rated value. That hot end matters at the bottom of the inverter's tracking window.
Current moves the other way. PVEducation describes the pattern for silicon: current rises slightly with temperature while voltage falls much more. The median Isc coefficient is 0.046 %/°C, with eight in ten between 0.040 and 0.050 %/°C. In the same hour the median module's Isc sits 1.6 % above its rating.
What an inverter's datasheet states
An inverter answers each module figure with a limit. The Fronius Primo GEN24 6.0 is one published example. Its DC input range is 65 to 600 V, so 600 V is the most it accepts. Its MPP voltage range is 230 to 480 V, the window in which it tracks the best operating point.
Its current limits differ between its two trackers, the separate MPPT inputs, so read them per input:
| Limit | First tracker | Second tracker |
|---|---|---|
| Maximum input current | 22 A | 12 A |
| Maximum array short-circuit current | 41.25 A | 22 A |
A footnote defines the second row: the array's short-circuit current is taken as at least Isc at STC times 1.25, citing IEC 60364-7-712, NEC 2020 and AS/NZS 5033:2021. That's the last column of the power-class table. Across the catalogue, the median module's Isc × 1.25 is 17.7 A, and 13 % of modules exceed the second tracker's 22 A array short-circuit limit on that measure with a single string.
These limits apply at the DC connectors on the inverter, one pair per string:
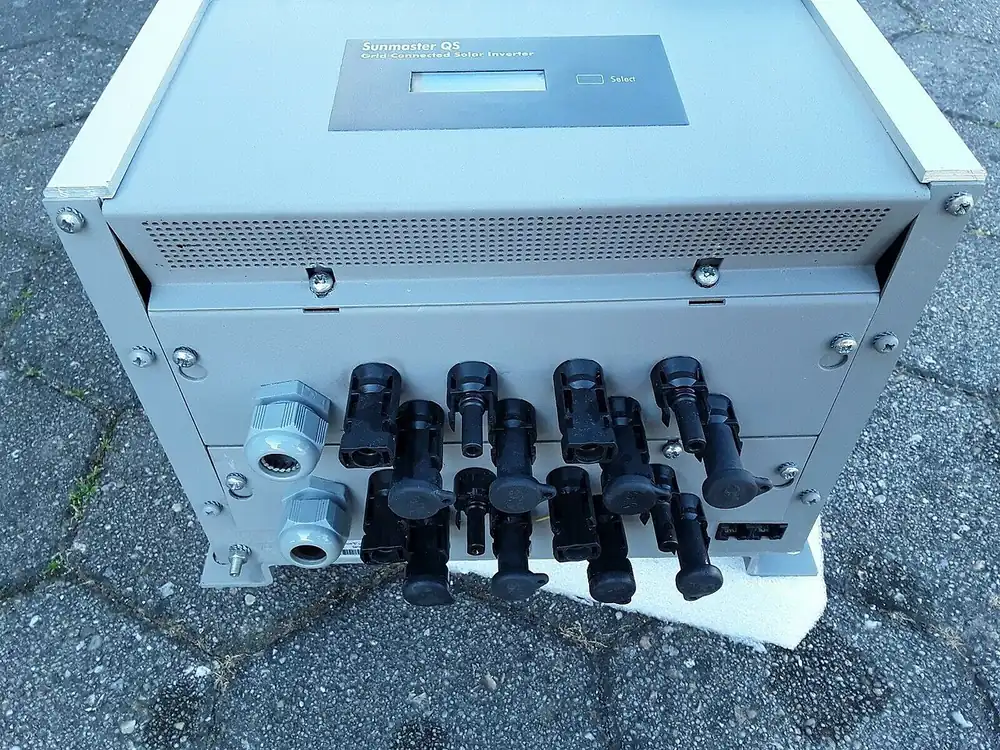

Other inverters print other numbers, so don't read anything into the Fronius figures themselves. They're one model's published data and say nothing about whether a given module suits a given inverter. What carries over is the shape: a maximum voltage, a tracking window, a maximum operating current and a maximum short-circuit current, each stated per input.
What this means when you buy
Read Voc and Isc together with their coefficients. The STC values are the starting point; the Voc coefficient tells you how far the voltage climbs on a cold morning. Two modules that look alike on power can differ on both.
If you're moving to bigger modules, look up their class in the power-class table and compare its Isc × 1.25 with the current limits of the inverter you have or plan to buy. An inverter chosen for smaller modules can have less headroom than the new ones need. Put that question to whoever designs the system before you settle on a module.
These are the pairs an installer checks:
- the string's cold Voc against the inverter's maximum input voltage and the module's maximum system voltage
- the string's operating voltage in the heat against the bottom of the MPP window
- Isc, times 1.25 where the inverter asks for it, against the current limits on each input
Leave the string sizing to the installer
How many modules go in one string, how many strings share an input and whether fuses are needed depend on the lowest temperature where you live, the inverter's full datasheet, the cables and the electrical rules in your country. Wiles suggests the record low for the site as the conservative choice. A string sized on a guess can exceed an inverter's or a cable's rating on the first cold morning.
The drawing keeps the two directions apart: modules in series add their voltages, strings in parallel add their currents.

Two example modules
Here are a smaller and a larger module side by side: the ones with the most shop offers on their ComparePV pages in the 400-499 W class and in the 700 W and up class when this was written, ties broken alphabetically.
Scorecard for this module: open its page on ComparePV.
Scorecard for this module: open its page on ComparePV.
The cards show four headline figures. Each module's page lists its Voc and Isc.
What these figures can't tell you
Every figure here is a manufacturer's claim, measured on sample modules at standard test conditions. We haven't tested any module ourselves.
The cold and hot temperatures are illustrations. Real cell temperatures depend on the site, the mounting and the weather.
The coefficient is treated as a straight line from 25 °C, which is how datasheets state it and how Wiles applies it. The catalogue holds no measurement at -10 °C to check that line against.
Figures and denominators
How the figures above were computed. Every figure is recomputed from the catalogue and the live shop offers when the page is served, and each one counts only the modules or offers that publish the value.
The figures cover every listable module, 14,005 of them, as each manufacturer's datasheet states it. A module counts toward a figure when the values it needs are in a plausible range: open-circuit voltage between 10 and 100 V, short-circuit current between 1 and 25 A, a Voc coefficient between -1 and 0 %/°C, an Isc coefficient between 0 and 0.2 %/°C, a NOCT between 35 and 55 °C, and a maximum series fuse between 5 and 60 A. Values outside those ranges are data entry errors, not datasheet claims.
The cold figure applies each module's own Voc coefficient to a cell at -10 °C, 35 degrees below the 25 °C of the rating: Voc at STC times one plus the coefficient times (-10 - 25). That is the method and the temperature of the worked example in John Wiles's IAEI column; -10 °C is an illustration, not a design temperature for any place.
The hot figures use the hot hour of the heat yield comparison tool: 30 °C air and 1000 W/m² of sunlight on an open rack, with each module's cell temperature from its NOCT (air plus (NOCT - 20) / 80 times the sunlight in mW/cm²). The Voc and Isc coefficients are then applied to the degrees above 25 °C.
The 1.25 factor and the 22 A limit are from Fronius's published technical data for the Primo GEN24 6.0, used as one example of how an inverter states its input limits. The power classes split modules by rated power at STC.
All 27 figures on this page and what each counts
| Figure | Value | Computed over |
|---|---|---|
| Cell at -10 °C: Voc above its STC value, median | 8.8 % | 13,929 modules |
| Open-circuit voltage at STC, median | 45.4 V | 13,925 modules |
| Short-circuit current at STC, median | 14.13 A | 14,002 modules |
| Open-circuit voltage at STC, 10th percentile | 37.0 V | 13,925 modules |
| Open-circuit voltage at STC, 90th percentile | 52.4 V | 13,925 modules |
| Short-circuit current at STC, 10th percentile | 10.53 A | 14,002 modules |
| Short-circuit current at STC, 90th percentile | 18.25 A | 14,002 modules |
| Maximum series fuse rating, median | 30 A | 13,240 modules |
| Maximum series fuse rating, 10th percentile | 20 A | 13,240 modules |
| Maximum series fuse rating, 90th percentile | 35 A | 13,240 modules |
| Modules rated for 1500 V system voltage | 12,612 | 14,005 modules |
| Modules rated for 1000 V system voltage | 988 | 14,005 modules |
| Temperature coefficient of Voc, median | -0.25 %/°C | 13,929 modules |
| Temperature coefficient of Voc, 10th percentile | -0.28 %/°C | 13,929 modules |
| Temperature coefficient of Voc, 90th percentile | -0.23 %/°C | 13,929 modules |
| Cell at -10 °C: Voc above its STC value, 10th percentile | 8.2 % | 13,929 modules |
| Cell at -10 °C: Voc above its STC value, 90th percentile | 10.0 % | 13,929 modules |
| Cell at -10 °C: Voc, median | 49.6 V | 13,850 modules |
| Cell at -10 °C: Voc, 90th percentile | 56.9 V | 13,850 modules |
| Hot hour (30 °C air, 1000 W/m²): Voc below its STC value, median | 9.1 % | 12,853 modules |
| Temperature coefficient of Isc, median | 0.046 %/°C | 13,900 modules |
| Temperature coefficient of Isc, 10th percentile | 0.040 %/°C | 13,900 modules |
| Temperature coefficient of Isc, 90th percentile | 0.050 %/°C | 13,900 modules |
| Hot hour (30 °C air, 1000 W/m²): Isc above its STC value, median | 1.6 % | 12,824 modules |
| Isc at STC times 1.25, median | 17.7 A | 14,002 modules |
| Share of modules whose Isc times 1.25 exceeds 22 A | 13 % | 14,002 modules |
| Modules in the catalogue | 14,005 | 14,005 modules |