PVGIS - Free Solar Energy Production Calculator
Photovoltaic Geographical Information System (PVGIS) is a free tool from the European Commission that allows you to precisely estimate energy production from a photovoltaic installation at any location worldwide.
Free
No registration or feesPrecise
Satellite data for your locationDetailed
Monthly and yearly productionOfficial
Data from EU Joint Research CentreWhat is PVGIS?
PVGIS (Photovoltaic Geographical Information System) is an interactive tool developed by the Joint Research Centre (JRC) - the European Commission's science and knowledge service.
The tool uses multi-year satellite data on solar irradiance, temperature, and other atmospheric factors to precisely calculate how much energy a photovoltaic installation will produce at a specific location.
Key Capabilities:
- Energy production calculation - for any PV system in Europe, Africa, parts of Asia, and the Americas
- Tilt angle optimization - find the optimal angle for maximum production
- Orientation analysis - compare east, west, and south-facing systems
- Hourly data - download detailed production data for every hour of the year
- Loss accounting - temperature, reflection, cabling losses
Joint Research Centre
The European Commission's science and knowledge service, headquartered in Ispra, Italy. Provides independent scientific advice for EU policy.
How to Use PVGIS? Step by Step
Select Your Location
When you open PVGIS, you'll see a world map. You can:
- Click on the map at the location where you plan to install panels
- Enter an address in the search field (e.g., "Phoenix, Arizona")
- Enter GPS coordinates if you know them
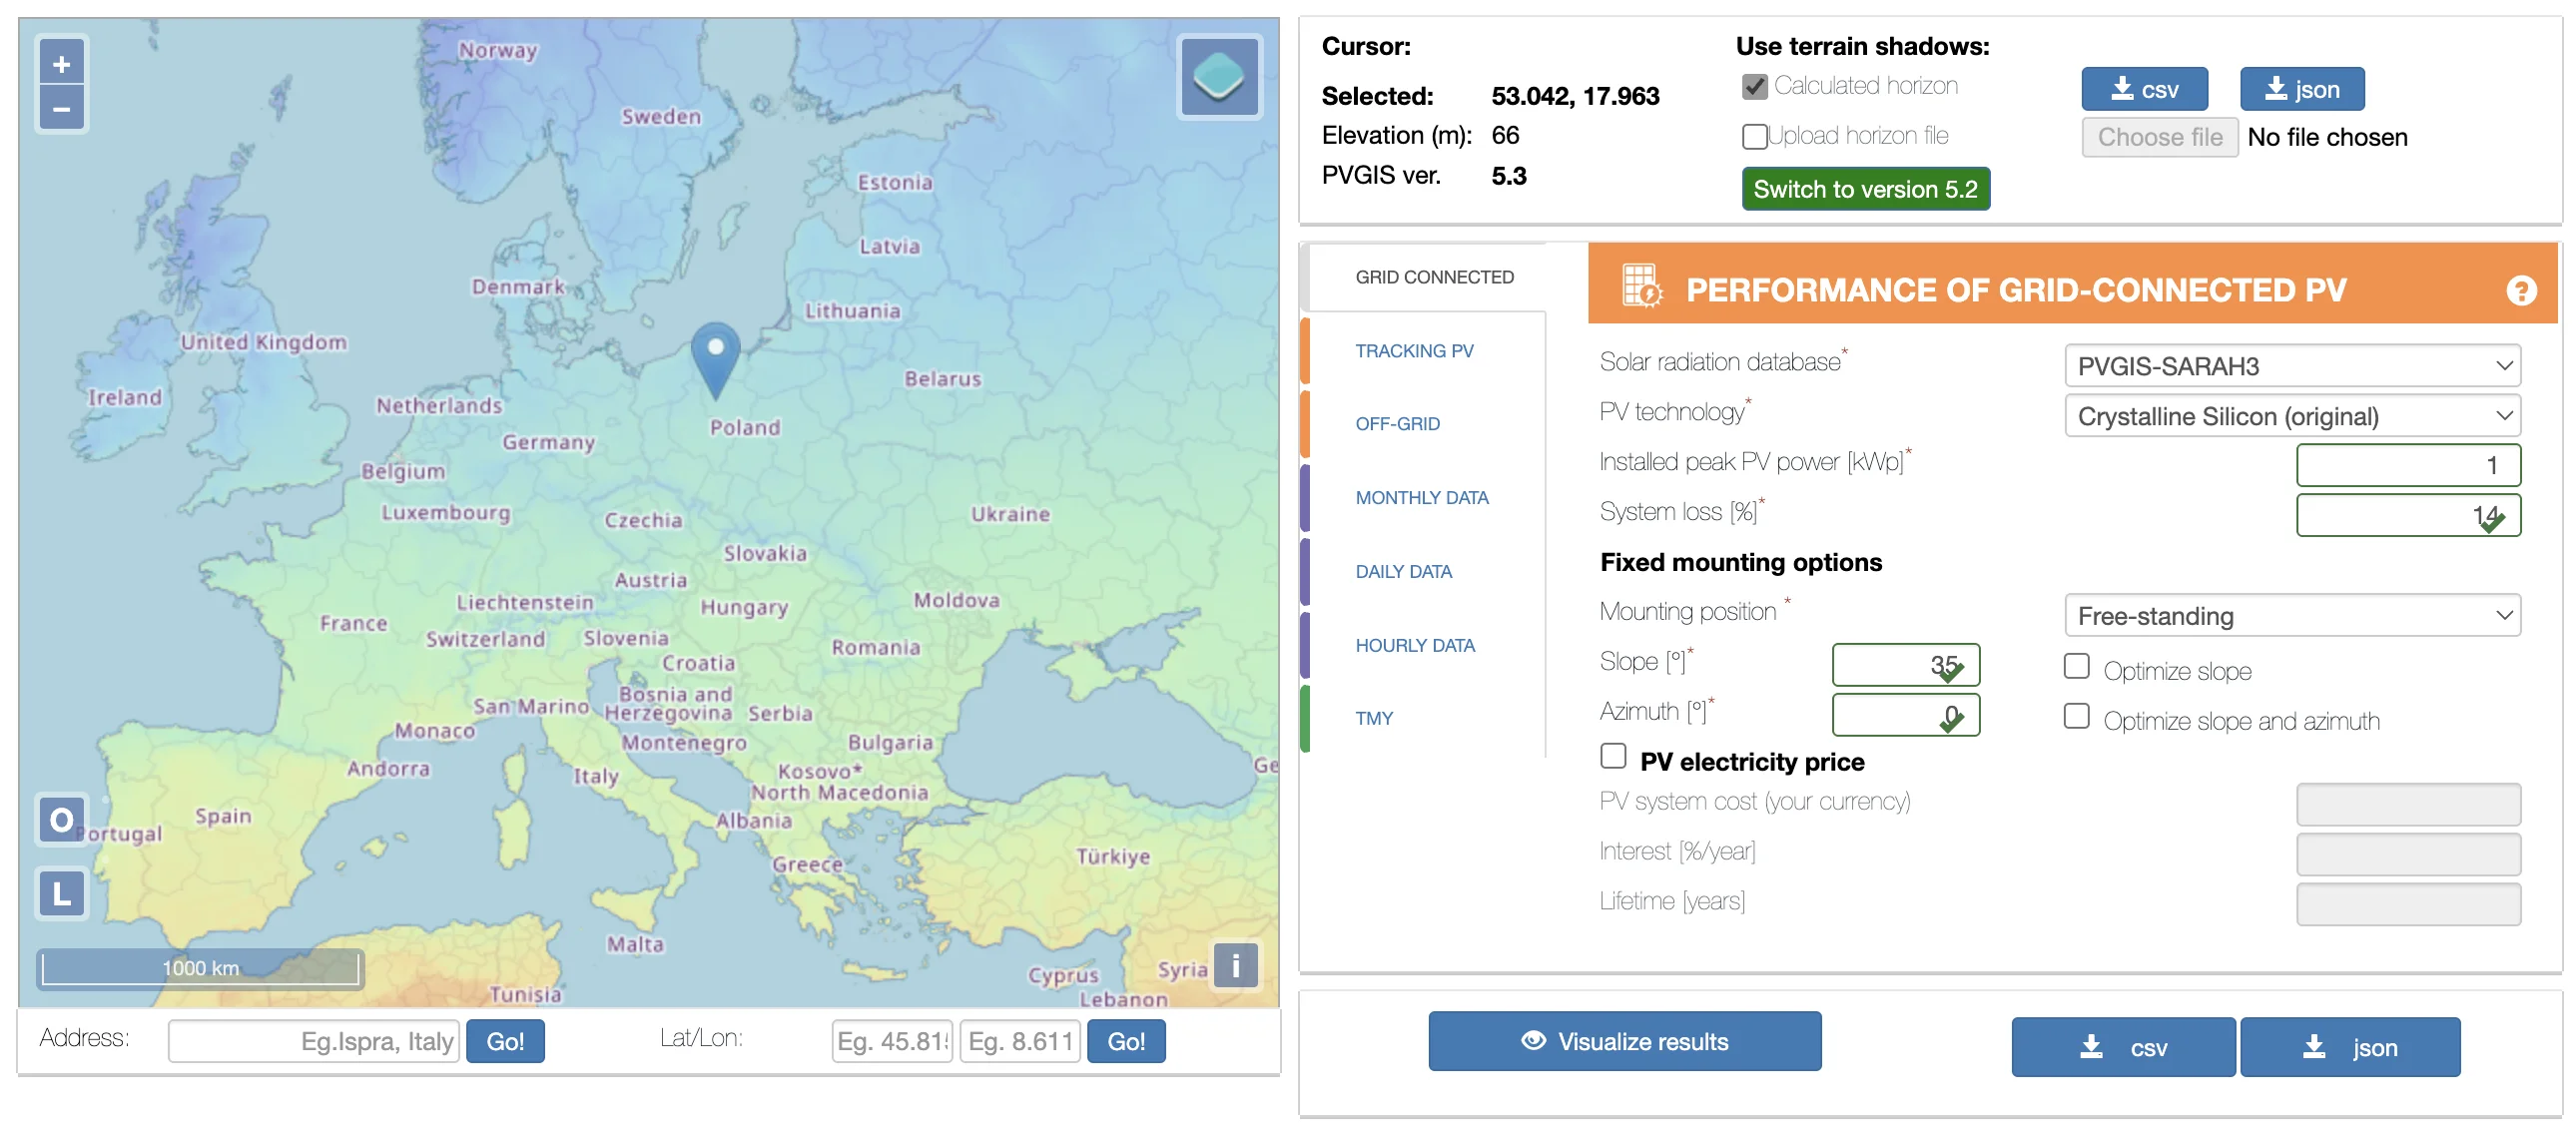 PVGIS interface with world map and PV installation parameters panel
Choose Calculation Type
PVGIS offers several types of analysis:
The most popular option - for installations connected to the grid. Calculates annual and monthly energy production.
For autonomous installations with energy storage, not connected to the electrical grid.
Set Installation Parameters
Enter data for your planned or existing installation:
System Size (kWp)
Total peak power of panels. E.g., 10 panels at 500Wp = 5 kWp.
Tilt Angle (slope)
Panel angle relative to horizontal. In the US, optimal is typically 25-40 degrees depending on latitude. You can select "Optimize slope" for automatic optimization.
Azimuth (orientation)
Panel direction: 0 degrees = south, -90 degrees = east, 90 degrees = west.
Advanced Loss Settings:
- System loss - losses in inverter, cables (default 14%)
- Mounting position - free-standing vs roof-integrated (affects cooling)
Analyze Results
After clicking "Visualize results" you'll receive:
Bar chart of energy production for each month of the year. You'll clearly see the difference between summer (May-August) and winter.
Detailed data: annual production (kWh/year), irradiance (kWh/m2), losses, optimal tilt angle.
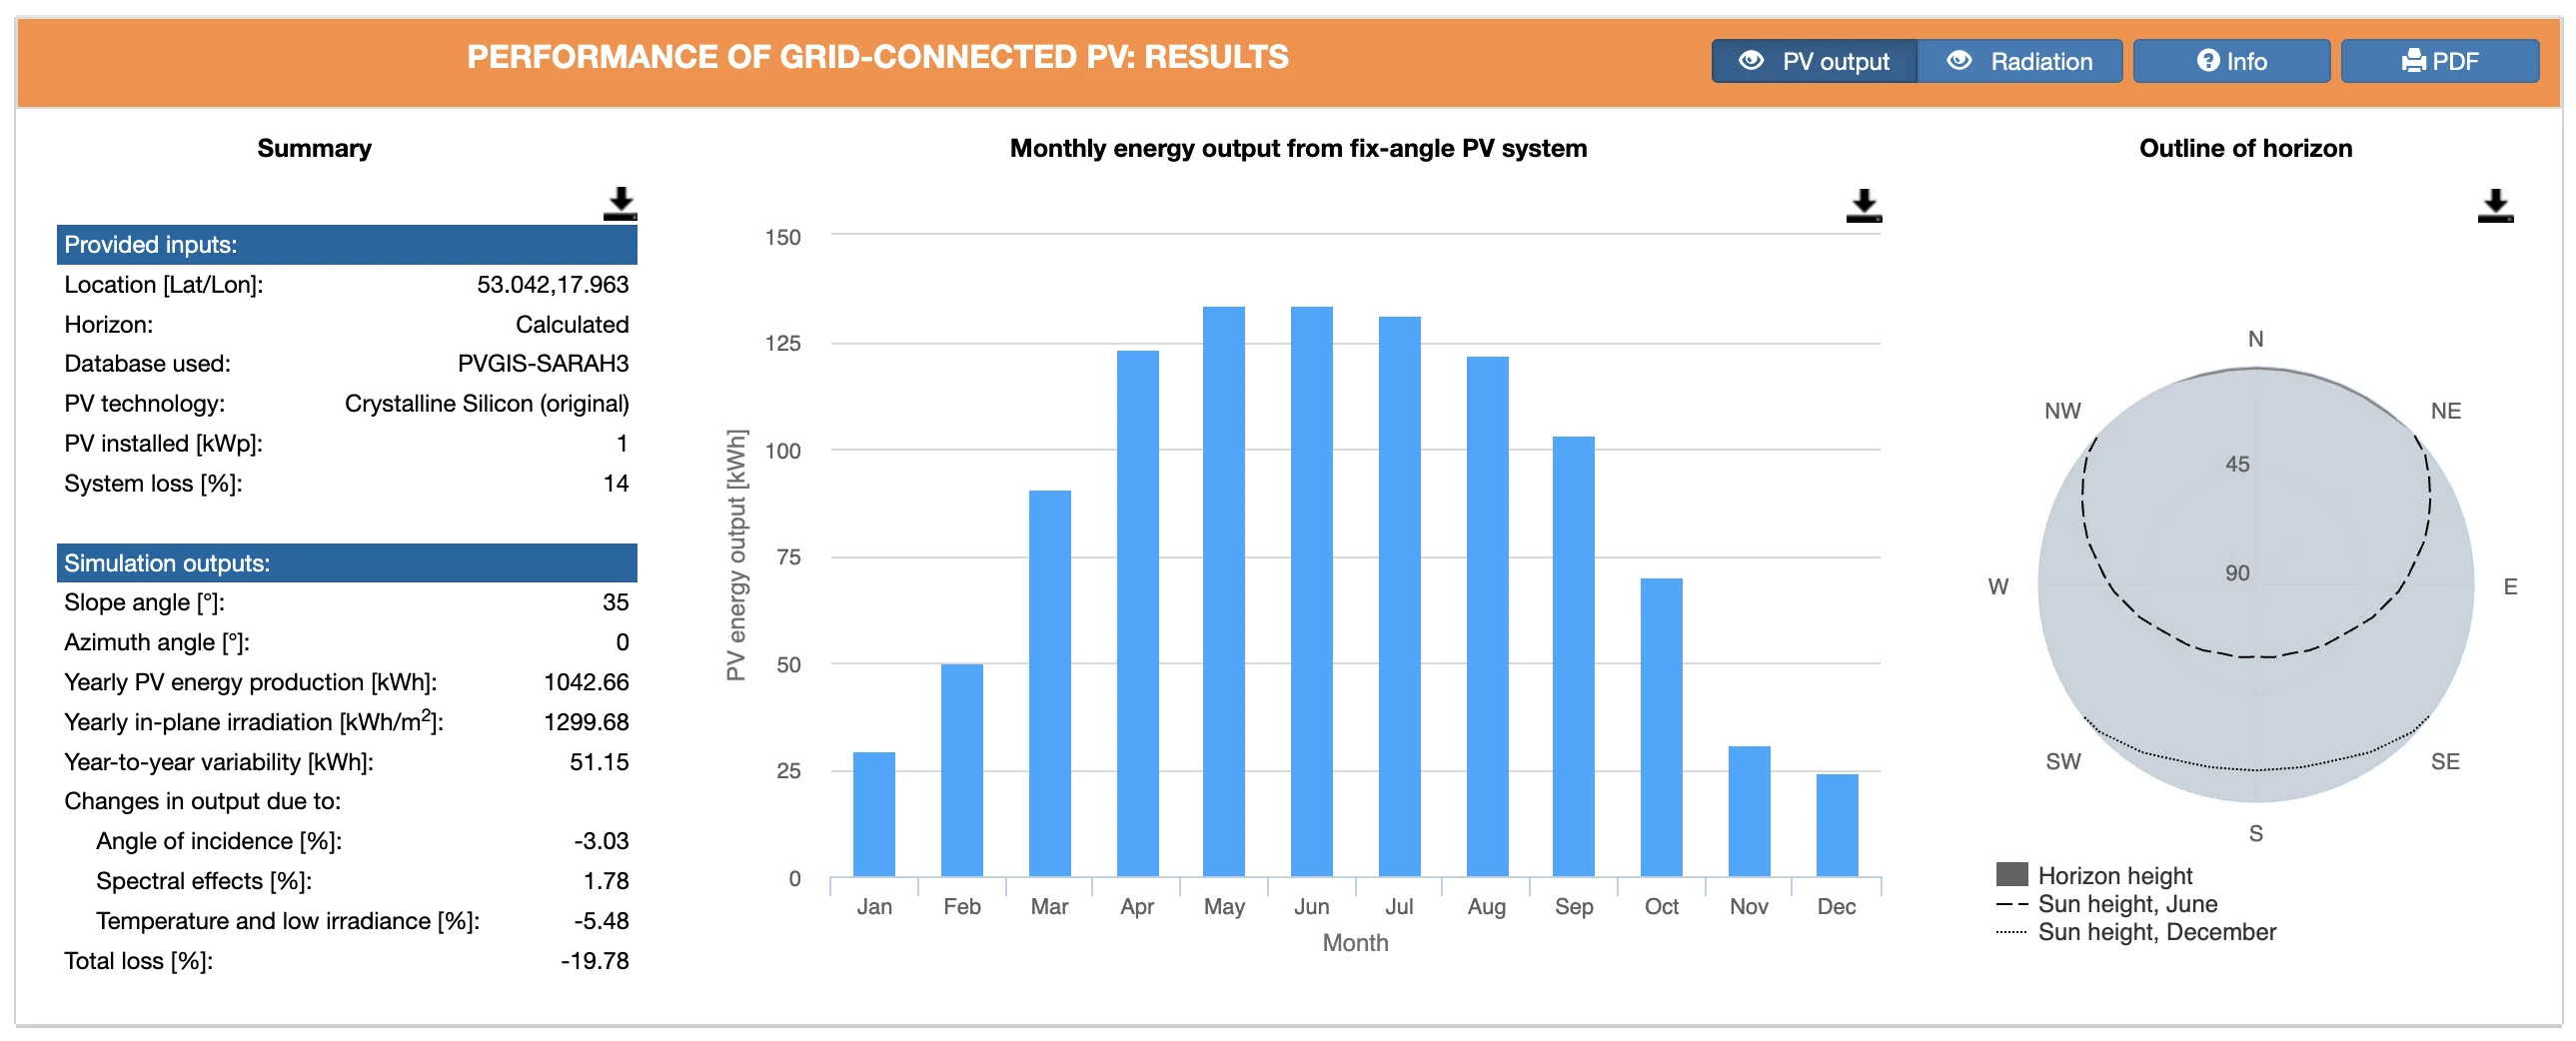 Example PVGIS results: monthly production chart and data table (showing kWh/year for a 1 kWp installation)
Interpreting Results - What Do the Numbers Mean?
Yearly PV Energy Production (kWh/year)
The most important value! How much energy your installation will produce in a year.
A 5 kWp installation: ~8,000-9,000 kWh/year
That's enough to power most homes in the Southwest!
Specific Production (kWh/kWp/year)
Production per 1 kWp of installed capacity. Allows comparing location efficiency regardless of installation size.
Southwest (Phoenix): ~1,700-1,800 kWh/kWp
South (Houston): ~1,400-1,500 kWh/kWp
Northeast (Boston): ~1,200-1,300 kWh/kWp
Global Irradiation (kWh/m2)
Total solar energy hitting the panel surface. In the US: ranges from 1,400-2,200 kWh/m2/year depending on location.
Total Loss (%)
Combined losses: temperature, reflection, inverter, cables. Typically 20-25% of total solar energy.
Optimal Angle
Optimal tilt angle for maximum annual production. In the US: typically 20-40 degrees (depends on latitude).
Solar Irradiance Across the United States
The United States has excellent solar resources, especially in the Southwest. Annual specific production ranges from about 1,000 to 1,800 kWh/kWp depending on location.
| Region | Example States | kWh/kWp/year | Characteristics |
|---|---|---|---|
| Southwest | Arizona, Nevada, New Mexico | 1,600-1,800 | Best solar resources in the country, desert climate |
| South | Texas, Florida, California | 1,400-1,600 | Excellent conditions, some humidity in Florida/Gulf Coast |
| Midwest | Illinois, Ohio, Missouri | 1,200-1,400 | Good conditions, continental climate |
| Northeast | New York, Massachusetts, Pennsylvania | 1,100-1,300 | Moderate conditions, more cloud cover |
| Pacific Northwest | Oregon, Washington | 1,000-1,200 | More overcast, but still viable for solar |
Solar Irradiance Across Europe
Europe has diverse solar resources, with Southern Europe offering the best conditions. Annual specific production ranges from about 800 to 1,700 kWh/kWp depending on location.
| Region | Example Countries | kWh/kWp/year | Characteristics |
|---|---|---|---|
| Southern Europe | Spain, Portugal, Italy, Greece | 1,400-1,700 | Best solar resources in Europe, Mediterranean climate |
| Central-South | Southern France, Croatia, Slovenia | 1,200-1,400 | Very good conditions, transitional climate |
| Central Europe | Germany, Austria, Czech Republic, Poland | 1,000-1,100 | Good conditions, continental climate |
| Western Europe | France, Belgium, Netherlands, UK | 900-1,100 | Moderate conditions, maritime influence |
| Northern Europe | Denmark, Sweden, Norway, Finland | 800-1,000 | Lower irradiance but long summer days compensate |
Practical Tips
- Check multiple locations - even a few miles difference can change results
- Use "Optimize slope" - PVGIS will find the optimal angle
- Download hourly data - useful for more detailed analysis
- Compare different orientations - east/west split can be better for self-consumption
- Use realistic losses - 14% is minimum, often more in practice
- PVGIS doesn't account for shading - trees, chimneys, neighboring buildings
- Historical data - results are based on past weather, future may differ
- Panel degradation - PVGIS doesn't account for efficiency loss over time
- Local conditions - fog, air pollution can reduce production
- Mounting type - roof-mounted panels get hotter than ground-mounted
Sources and Documentation
- PVGIS - Photovoltaic Geographical Information System (official site)
- PVGIS Documentation - Joint Research Centre
- "Overview of PVGIS v5" - Scientific publication (Solar Energy, 2016)