
Performance
How much power do solar panels lose each year?
What datasheets allow a solar panel to lose each year, what field studies measure, and what a faster rate costs in kWh over a 30-year life.
In short: The performance warranty on a typical module in our catalogue allows 1.0 % in the first year and 0.40 %/yr after that. Field studies of older modules and systems measured a median around 0.5 %/yr, and 0.75 %/yr for whole US systems that include more than the modules. Over 30 years each extra 0.1 %/yr costs roughly 1.5 % of everything the roof makes, so the annual figure is worth reading before you buy, but it rarely decides a purchase alone.
Every solar panel loses power slowly. The datasheet tells you how fast the manufacturer is willing to promise, field studies tell you how fast panels in the past actually did it, and the two are not the same kind of number. This article puts them side by side and turns the difference into kilowatt-hours.
The array below, SMUD PV1 near Sacramento, went up in 1984 and ran for 27 years. Fields like it are where the long-term degradation figures come from: you can only measure 25 years of ageing on a module that has been outside for 25 years.
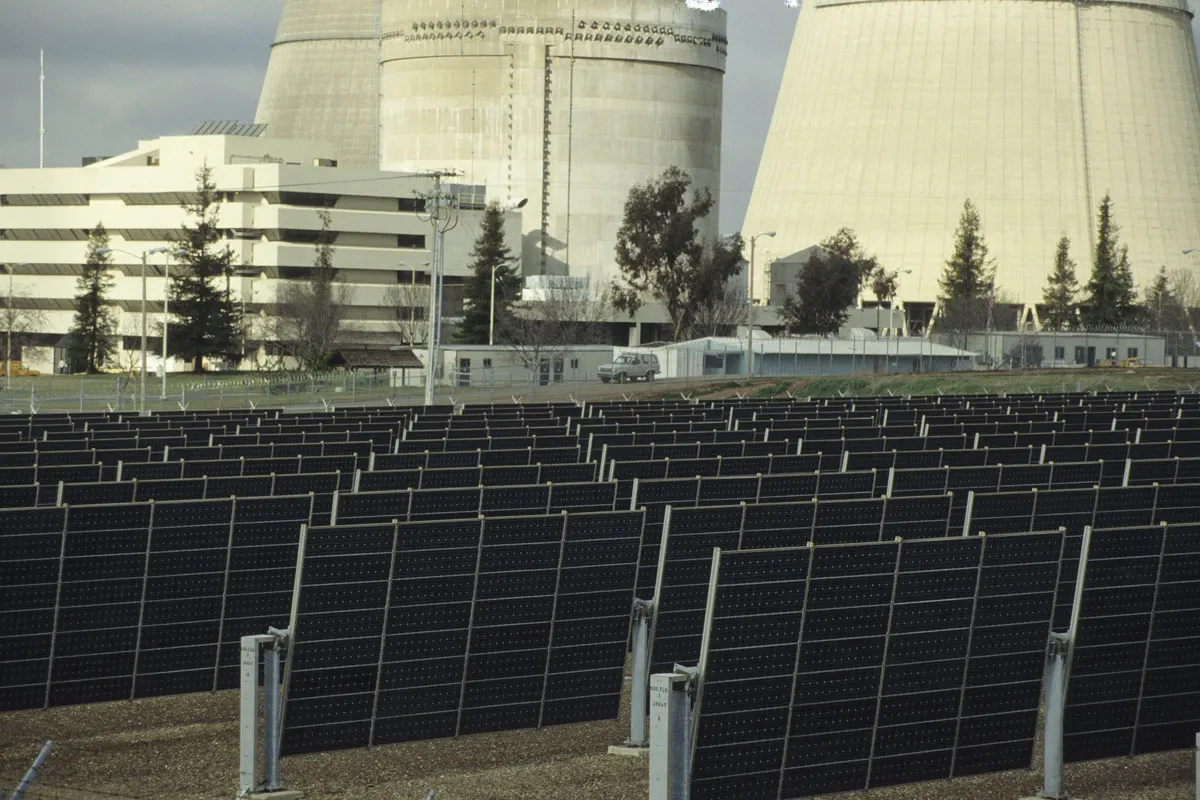

First-year loss and yearly loss are two different things
A datasheet's degradation line has two numbers, and they describe two different processes.
The first-year figure covers what happens in the first weeks and months of sunlight. Light-induced degradation, LID, and its slower, heat-driven relative LeTID take a step off a fresh cell's power before it settles. The TOPCon or PERC article traces the classic form of this loss to boron-oxygen defects in boron-doped p-type wafers. The first-year allowance is the manufacturer's estimate of that step plus a margin.
The annual figure covers everything after: encapsulant yellowing, corrosion at the contacts, slow loss at cracks and solder joints. It is applied every year for the length of the performance warranty, so it compounds into the bigger number. A percentage point taken once in year one costs 1 % of a 30-year output. An annual loss is paid again in every later year, on top of all the years before, so over 30 years even 0.07 %/yr costs as much as that whole first-year point. The sums are further down.
That is why I read the two separately. A low first-year figure is pleasant; a low annual figure is the one that pays.
What datasheets promise
Of the 14,005 modules in our catalogue, 11,535 state a first-year allowance. The table gives the median and the 10th and 90th percentiles of both allowances. The 10th percentile is the stricter end: a tenth of modules allow that much or less.
| Allowance | 10th percentile | Median | 90th percentile |
|---|---|---|---|
| First year | 1.0 % | 1.0 % | 2.5 % |
| Each year after | 0.35 %/yr | 0.40 %/yr | 0.55 %/yr |
The middle eight in ten modules sit between the two outer columns. If the 10th percentile and the median are the same number, the stricter half of the market has settled on one figure and you will see it on datasheet after datasheet.
The histogram shows the annual allowance across the whole catalogue. Allowances are terms a manufacturer chooses, not measurements, so look for where the bars bunch rather than for a smooth curve.
The numbers behind the chart
| Annual degradation (%/yr) | Modules |
|---|---|
| <0.25 | 53 |
| 0.25-0.30 | 123 |
| 0.30-0.35 | 501 |
| 0.35-0.40 | 718 |
| 0.40-0.45 | 5,632 |
| 0.45-0.50 | 1,051 |
| 0.50-0.55 | 884 |
| 0.55-0.60 | 2,138 |
| 0.60+ | 446 |
The end figure is usually the same promise
12,330 modules also state the power they keep at the end of the performance warranty, which runs 30 years at the median; the median end figure is 87.4 %. It looks like a third promise, but it may be the first two in disguise. Take 100, subtract the first-year loss, subtract the annual loss for every year after the first, and you get the end figure.
I checked that on every module that states all four numbers. Of 10,820 such modules, 10,432 land within half a point of their own end figure. The closer the two counts, the more the end figure is just the schedule written as one number, and the more the annual allowance is the only figure you need to compare. The warranty article covers what a claim against that schedule involves.
The modules that promise the least ageing
These are the modules with the lowest stated annual allowance in the catalogue, picked by the catalogue itself when the page is served:
Top 3 by the lowest annual degradation, one module per datasheet, among 11,546 modules with a stated annual degradation, as of the last catalogue sync.
Scorecard for this module: open its page on ComparePV.
Scorecard for this module: open its page on ComparePV.
Scorecard for this module: open its page on ComparePV.
A low allowance is a promise the manufacturer has to honour, so it does carry information. It is still a warranty term, not a measurement of the module in front of you.
What field studies measure
A warranty is a ceiling the manufacturer accepts responsibility for. The question a buyer actually has is how fast modules really age, and only fields of real modules answer it.
Jordan and Kurtz, NREL, 2012. A widely cited summary pulls together nearly 2,000 degradation rates measured on individual modules or whole systems over four decades of field testing. The median is 0.5 %/yr and the mean 0.8 %/yr; the distribution has a long tail of bad performers. 78 % of the rates are below 1 %/yr. The authors are frank about the bias in their own sample: modules that degrade fast are less likely to stay in the field and be reported on again, and studies of up to ten years show a higher median than longer ones. The authors tried to leave out the short-term light-induced loss, though they say its influence can't be excluded completely, so the rates compare with a datasheet's annual figure, not its first-year one.
Jordan and colleagues, 2022. The PV Fleet Performance Data Initiative looked at operating US commercial and utility systems: more than 7.2 GW, 1,700 sites and 19,000 inverters. The overall performance loss rate is 0.75 %/yr. Climate matters: the median loss is 0.48 %/yr in cooler climates and 0.88 %/yr in hotter ones. This is a system figure, so it can include losses the module warranty never covers, from inverters to wiring.
Now hold these against the datasheet median above. Where the catalogue median sits below 0.5 %/yr, today's warranties promise slower ageing than the typical module of the last four decades achieved. That isn't a contradiction. All of those field rates come from modules installed before the review appeared in 2012, many of them before 2000, with older cells and older encapsulants, and the newest designs haven't been outside long enough for anyone to measure 25 years of them.
The climate split in the 2022 study is worth keeping in mind if your roof is hot. Heat doesn't only cost output in the moment, as the hot climate article shows; it also seems to speed up ageing.
By cell technology
Datasheets for the three main cell technologies allow different amounts. Check the module counts under the article before trusting a small group's median.
| Technology | First-year allowance | Annual allowance |
|---|---|---|
| TOPCon | 1.0 % | 0.40 %/yr |
| PERC | 2.0 % | 0.55 %/yr |
| HJT | 1.0 % | 0.30 %/yr |
Where PERC allows more in the first year, the boron-oxygen defect above is a physical reason for it: PERC is usually built on p-type wafers and TOPCon and HJT on n-type ones. Manufacturers have also moved p-type wafers from boron to gallium doping, and the IEA PVPS Task 13 report of February 2025 calls LID and LeTID "well understood and solved" by that switch, together with process changes.
The same report is a reason not to treat the newer technologies as finished. It finds that "in some solar modules with TOPCon and SHJ cells, UVID is pronounced after accelerated aging tests", UVID being degradation caused by ultraviolet light, and that it is "still unclear whether the degradation can be reversed by outdoor exposure". It also stresses that UVID is solvable, since some modules come through the tests UV-stable. A low annual allowance on a TOPCon or HJT datasheet is the manufacturer betting on that; nobody has 25 years of field data to confirm it yet.
What the difference is worth in kWh
Percentages per year are hard to feel, so here is the same thing as energy. I use the two field figures as the example rates: 0.5 %/yr from the 2012 review and 0.75 %/yr from the 2022 fleet study, no extra first-year loss, on a site making 1,000 kWh per kWp in the first year. That yield is an example input, not a catalogue figure; the specific yield of your own roof is what you would plug in.
Year y keeps 100 - rate × (y - 1) percent of the rating. Over 30 years the shares add up to 30 - rate × 435 / 100 years of full output, because the year counts 0 to 29 sum to 435.
- At 0.5 %/yr: 1,000 × (30 - 2.175) = 27,825 kWh per kWp, and the module gives 100 - 0.5 × 29 = 85.5 % of its rating in year 30.
- At 0.75 %/yr: 1,000 × (30 - 3.2625) = 26,738 kWh per kWp, and 100 - 0.75 × 29 = 78.25 % in year 30.
The slower module makes 1,088 kWh more per kWp, 4.1 % more over the 30 years. On a 5 kWp roof that is about 5,440 kWh, spread thinly over three decades.
Two rules of thumb fall out of the same sum, at 1,000 kWh per kWp over 30 years:
- Each 0.1 %/yr of annual loss costs 1,000 × 0.1 × 435 / 100 = 435 kWh per kWp, about 1.5 % of the lifetime total.
- Each percentage point of first-year loss costs 1,000 × 30 × 0.01 = 300 kWh per kWp, exactly 1 %.
Scale both with your yield: at 1,500 kWh per kWp they grow by half. Multiply by what a kilowatt-hour is worth to you and you have the money; the payback calculator does that for a whole system, with both degradation figures as inputs.
The figure below runs the sum live. Module A starts on the catalogue's 10th-percentile annual allowance, module B on its 90th, both on the median first-year figure and the median performance warranty length.
What slower ageing adds up to
Set two modules' first-year and annual losses, your site's yield and the years, and see each year's output as a staircase, with the energy the slower-ageing module adds shaded between them.
How this is computed
Each year's energy per kWp = specific yield × (100 - first-year loss - annual loss × (year - 1)) / 100, never below zero. The first year already carries the whole first-year loss, the same convention as the payback calculator, whose model this figure reuses. The total is the sum over the years; the difference is A's total minus B's, and its share is the difference over the smaller total.
The losses follow a straight line, the shape a performance warranty draws. Real modules do not: early losses come in steps, and field studies find faster ageing in hot climates. The yield is the same in every year, so weather, shade, soiling and inverter losses are left out; they cost both modules alike. The datasheet figures are allowances the manufacturer will answer for, not measurements of how a module will age.
Illustrative model, not a measurement.
How I read the figures
The catalogue figures are what manufacturers printed in the warranty section of their datasheets, read row by row; one datasheet with eight power ratings counts as eight modules. None of them is a measurement of a module ageing.
The field figures come from two NREL studies and are typed here with their source, because they don't change with our catalogue. Neither measures any module sold today: the 2012 review is mostly older modules, and the 2022 study measures whole systems in the US.
The kWh sums use a straight line, the same shape a performance warranty draws. Real modules don't age in straight lines, a hot year and a cool year differ by more than one year's ageing, and the yield is an example. The sums show the size of the effect, not your roof's future.
What to do with this when buying
Compare annual allowances when everything else is close. Between two modules a few percent apart on price per watt, a 0.1 %/yr difference in the annual figure is worth about 1.5 % of lifetime output, which can tip the choice. Across a bigger price gap it won't.
Read the annual figure before the first-year one. A point in year one costs 1 % of the lifetime output; over 30 years any annual loss above 0.07 %/yr costs more than that.
Don't budget on the warranty line. Plan your yield on something between the datasheet's annual figure and the field figures, and add a little more if your roof gets hot. The warranty is what you can claim against, not what you should expect.
Treat a very low allowance on a new design as a promise, not a proof. It is worth exactly as much as the company that has to honour it in year 25, which is why the warranty terms article is the next thing to read.
Figures and denominators
How the figures above were computed. Every figure is recomputed from the catalogue and the live shop offers when the page is served, and each one counts only the modules or offers that publish the value.
Catalogue figures are computed from the modules listed in our catalogue (the rankings view, which keeps only modules with a power rating and a page): 14,005 modules. Each is a row read from its manufacturer's datasheet, and one datasheet usually covers a ladder of power ratings, so a datasheet with eight ratings is eight modules here.
Degradation figures are the performance warranty's allowances, not measurements. The annual figure counts when it is above 0 and below 2 % per year, the first-year figure when it is above 0 and below 5 %; outside those ranges a value is a misread column. The consistency check takes the modules that state both allowances, a performance warranty length and the power promised at its end, and counts a module as consistent when 100 minus the first-year loss minus the annual loss for every year after the first lands within half a point of the stated end power. A module counts as TOPCon, PERC or HJT when its datasheet names that cell technology.
The kWh figures in the text are arithmetic on example inputs, not catalogue values: a site making 1,000 kWh per kWp in a year, and the field figures quoted from the two NREL studies. Year y keeps 100 minus the first-year loss minus the annual loss times (y - 1) percent of the rating, the same straight line a performance warranty draws.
All 19 figures on this page and what each counts
| Figure | Value | Computed over |
|---|---|---|
| First-year degradation allowance, median | 1.0 % | 11,535 modules |
| Annual degradation, median | 0.40 %/yr | 11,546 modules |
| Modules in the catalogue | 14,005 | 14,005 modules |
| Modules stating a first-year degradation allowance | 11,535 | 14,005 modules |
| First-year degradation allowance, 10th percentile | 1.0 % | 11,535 modules |
| First-year degradation allowance, 90th percentile | 2.5 % | 11,535 modules |
| Annual degradation, 10th percentile | 0.35 %/yr | 11,546 modules |
| Annual degradation, 90th percentile | 0.55 %/yr | 11,546 modules |
| Modules stating the power promised at the end of the performance warranty | 12,330 | 14,005 modules |
| Performance warranty, median | 30 years | 13,877 modules |
| Power promised at the end of the performance warranty, median | 87.4 % | 12,330 modules |
| Modules with both degradation figures and an end-of-warranty power | 10,820 | 14,005 modules |
| Modules whose warranty end power follows from the degradation figures within 0.5 point | 10,432 | 14,005 modules |
| TOPCon: first-year degradation allowance, median | 1.0 % | 4,889 modules |
| TOPCon: annual degradation, median | 0.40 %/yr | 4,937 modules |
| PERC: first-year degradation allowance, median | 2.0 % | 3,459 modules |
| PERC: annual degradation, median | 0.55 %/yr | 3,356 modules |
| HJT: first-year degradation allowance, median | 1.0 % | 594 modules |
| HJT: annual degradation, median | 0.30 %/yr | 610 modules |
Related tools
Reference list
- Jordan and Kurtz, Photovoltaic Degradation Rates, An Analytical Review, NREL/JA-5200-51664, June 2012 (Progress in Photovoltaics), OSTI record
- Jordan, Anderson, Perry, Muller, Deceglie, White and Deline, Photovoltaic fleet degradation insights, Progress in Photovoltaics 30 (10), 2022
- IEA PVPS Task 13, Degradation and Failure Modes in New Photovoltaic Cell and Module Technologies, Report IEA-PVPS T13-30:2025, executive summary