
Buying
How many solar panels does a household need
Yearly kWh, your site's yield in kWh/kWp and one module's power give the module count. Worked for Warsaw, Munich and Seville, with the catalogue spread.
In short: divide your yearly consumption in kWh by your site's specific yield in kWh/kWp, divide that by one module's rated power and round up. For an example household using 4,000 kWh a year, the median count across our catalogue is 8 modules in Warsaw and 5 in Seville. The module you pick moves the Warsaw count from 6 at the 10th percentile to 11 at the 90th.
There's no single number of panels for a house of a given size. There's a short calculation with three inputs: how much electricity you use, how much a kilowatt of modules makes where you live, and how much power one module has. Only the last one is about the panels. The first two set the answer, and the module decides how many pieces it comes in and how much roof they take.
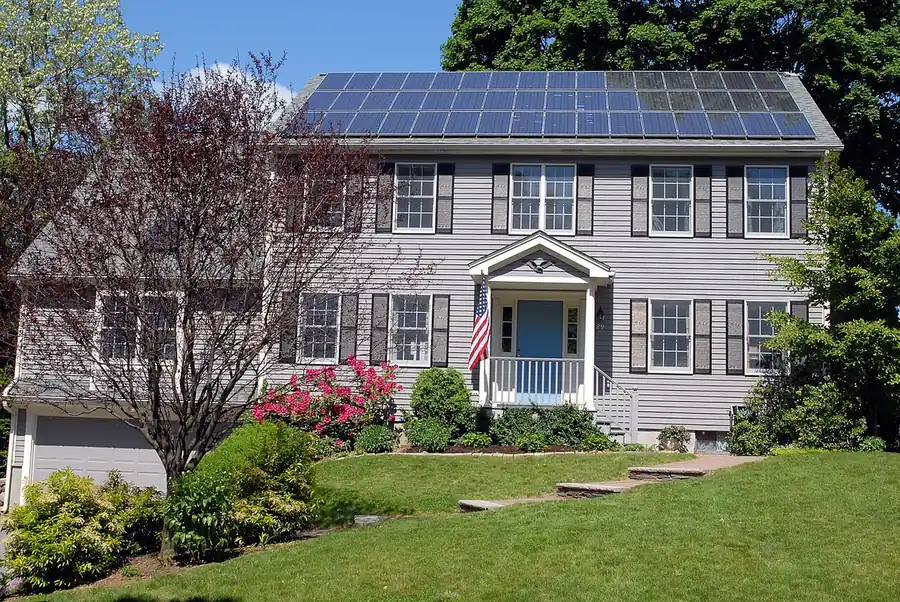

How to work out the number of modules
Step one: the power you need, in kWp
Divide your annual consumption in kWh by the specific yield of your site in kWh/kWp. The result is the rated power that would make as much energy in an average year as you use.
Take the consumption from a full twelve months of bills. Specific yield is how many kWh one kWp of modules makes in a year at a given spot, and it depends on the place, the tilt and the direction the roof faces. The European Commission's free PVGIS tool gives it for any location it covers.
Keep the units apart. kWp is a rating of the modules, measured in a lab. kWh is energy, what your meter counts and your bill charges for.
Step two: the number of modules
Divide that power by one module's rated power and round up. Rated power is measured at standard test conditions: 1000 W/m² of light and a cell temperature of 25 °C. Modules come whole, so the system always lands at the power you need or a little above it.
Worked example: Warsaw, Munich and Seville
The example household uses 4,000 kWh a year. I picked that number to keep the arithmetic easy; it isn't typical for any country, so put in your own. The yields are PVGIS figures for 1 kWp at the best fixed tilt and orientation, with its default 14 % system loss. The module is an example of 450 W.
Each row is two steps: 4,000 divided by the yield gives the needed kWp, and that divided by 0.45 kWp gives the count before rounding, shown in brackets.
| Site | Yield (kWh/kWp) | Needed (kWp) | 450 W modules | Installed (kWp) |
|---|---|---|---|---|
| Warsaw | 1,052.59 | 3.80 | 9 (from 8.4) | 4.05 |
| Munich | 1,140.73 | 3.51 | 8 (from 7.8) | 3.60 |
| Seville | 1,671.76 | 2.39 | 6 (from 5.3) | 2.70 |
Same household, same module, three answers. Warsaw needs half again as many modules as Seville, and the site is the one input you can't change short of moving house.
The rounding shows too. Nine modules in Warsaw make 4.05 kWp against the 3.80 kWp needed, a quarter of a kilowatt you didn't strictly ask for.
Put in your own figures below. The chart also splits the year into months, which matters further down.
How many modules for your consumption
Set your yearly use, your site's yield and a module, and see the power, the module count and the roof it takes, with the year's production month by month against your use.
How this is computed
Power needed = yearly consumption × target share / (specific yield × (1 - extra loss)). Modules = power needed / rated power, rounded up to a whole module, so the system always ends at the power needed or a little above it. Installed power = modules × rated power; roof area = modules × module area; production = installed power × the derated yield.
The three sites are PVGIS 5.3 figures for 1 kWp of crystalline modules, free-standing at the optimal fixed angles with PVGIS's 14 % system loss, the article's sources. Their yields already include those losses; the extra loss slider is for a roof that faces away from the optimum or is shaded (an east-facing 35 degree roof in Warsaw is about 21 %). Use PVGIS for your own roof and type its figure in.
The months split the year's production by the site's PVGIS monthly shares, and consumption is spread evenly over the twelve months. Both are simplifications: a real household uses more in winter, and a real year's weather moves the bars by several percent. The model does not count self-consumption, export, a battery, module ageing or the roof area lost to margins and gaps between rows; the roof area is the modules' own.
Illustrative model, not a measurement.
The roof's direction moves it as well
PVGIS puts the same 1 kWp in Warsaw, on a roof tilted 35 degrees and facing east, at 835.69 kWh a year. That's 79 % of the optimal figure. The household then needs 4,000 / 835.69 = 4.79 kWp, and 4.79 / 0.45 = 10.6, so 11 modules of 450 W instead of 9.
A national average, or a yield borrowed from a sunnier city, can be off by a fifth like this, and nothing in a quote will tell you.
How much the module changes the count
The table runs the same arithmetic for every catalogue module that states a rated power, 14,005 of them. The gap between the "Fewest" and "Most" columns is the module's size at work. The exact counting rules are under "Figures and denominators" below the article.
| Site | Modules, median | Fewest (10th pct) | Most (90th pct) | Installed kWp, median |
|---|---|---|---|---|
| Warsaw | 8 | 6 | 11 | 4.05 |
| Munich | 8 | 6 | 10 | 3.72 |
| Seville | 5 | 4 | 7 | 2.64 |
A module of higher rated power covers the need in fewer pieces. Rated power in the catalogue runs from 370 W at the 10th percentile to 655 W at the 90th, with a median of 495 W.
Roof area can cap the count
On a small roof the area can run out before your consumption is covered. What sets the area of a kilowatt is module efficiency, the share of the light on a module that comes out as electricity. Size doesn't: fewer, larger modules of the same efficiency take about the same roof as more, smaller ones.
So area and count needn't move together. The table gives the total area those counts take, for modules that state their length and width. Set its spread beside the count spread above; what's left in it comes from efficiency and rounding, not from module size.
| Site | Smallest (10th pct, m²) | Median (m²) | Largest (90th pct, m²) |
|---|---|---|---|
| Warsaw | 17.6 | 18.6 | 20.7 |
| Munich | 15.6 | 17.5 | 19.1 |
| Seville | 10.8 | 12.3 | 13.7 |
Efficiency in the catalogue runs from 19.6 % at the 10th percentile to 23.2 % at the 90th. The roof a kilowatt needs moves in inverse proportion, so a more efficient module puts the same kWp on less roof.
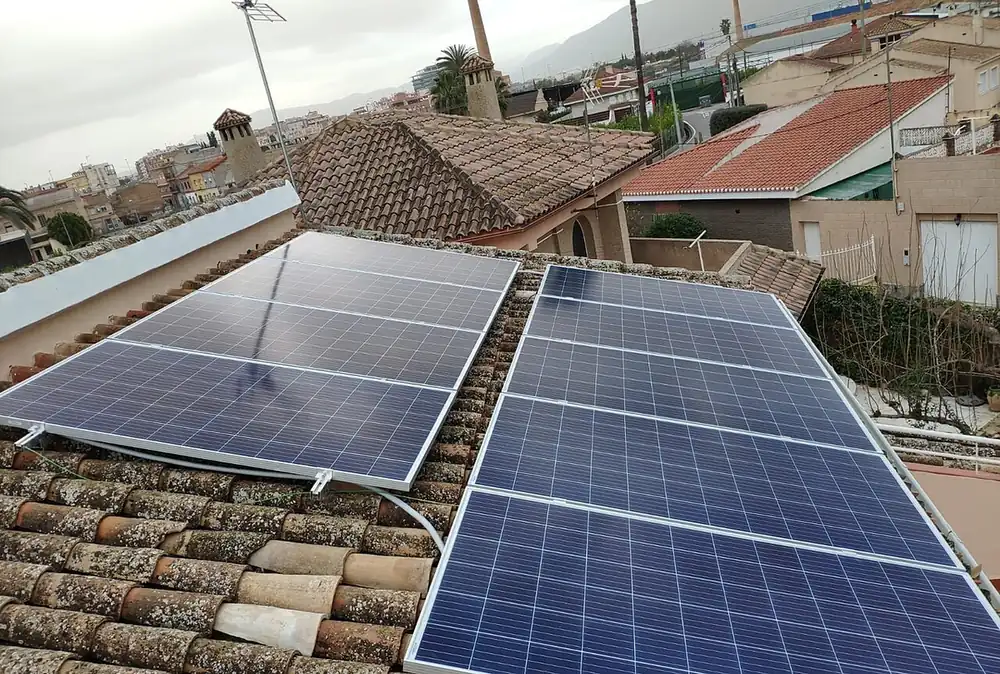

If the roof can't take the power you need, buy a more efficient module or accept a smaller system that covers part of your use. The roof-fit selector tries every module size in the catalogue on your roof and ranks them by kWp; the article on small roofs works through the trade.
What the modules cost
At the median price per watt of single rooftop modules in live shop offers, before VAT, the modules for the Warsaw example cost about 555 EUR at Polish prices and those for Munich about 622 EUR at German prices. Both are for the needed power, not the rounded-up system.
That's the modules and nothing else. Mounting, the inverter, cables and labour aren't in it, so compare whole-system quotes with each other, not with this figure. The price per watt article shows the spread around those medians, market by market.
What this means when you buy
Start from the kWp. It follows from your consumption and your site, and it's the figure to compare between offers. A quote for 8 modules and one for 10 can be the same power; 10 modules of 400 W and 10 of 500 W are not.
Get the yield for your own roof's tilt and direction from PVGIS. The solar payback calculator then turns that yield and a system price into a payback period.
Watch the rounding. A need just above a whole number of modules costs a whole extra module: in Warsaw, 8.4 became 9. Eight modules of 480 W make 8 × 0.48 = 3.84 kWp and cover the 3.80 kWp on their own. When a slightly larger module saves you one, compare the kWp of the two offers.
Before you ask for quotes, I would have these ready:
- your consumption over a full year, in kWh;
- the PVGIS yield for your roof's tilt and direction, in kWh/kWp;
- the power that gives you, in kWp;
- the usable roof area, in m².
Covering the year is not covering every month
The calculation matches a year of production to a year of use. Month by month they don't match.
PVGIS's monthly figures for 1 kWp in Warsaw run from 26.3 kWh in December to 133.0 kWh in June. The 3.80 kWp system makes about 3.80 × 26.3 = 100 kWh in December and 3.80 × 133.0 = 505 kWh in June, against 4,000 / 12 = 333 kWh of use in an average month.
So the summer surplus goes out through the meter to the grid, or into a battery if there is one, and in winter the grid makes up the gap. The schematic below shows where each part sits.
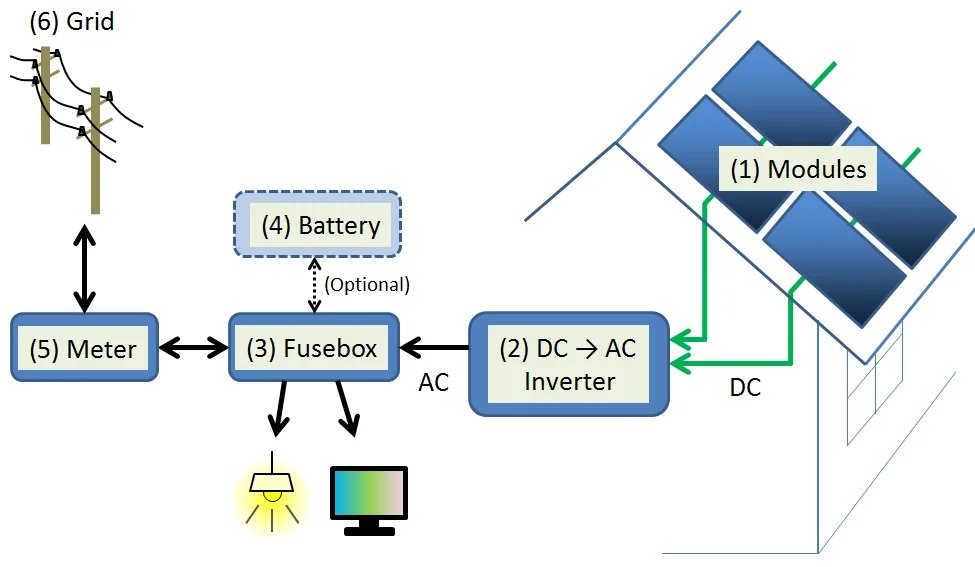

How much of the summer export counts against winter use depends on the billing rules where you live, which is a question for your grid operator or supplier. A home battery moves energy from the afternoon to the evening. It doesn't move June into December.
An example module and its prices
Below is the module that had the most shop offers in our data when this was written (ties broken alphabetically), with its three lowest offers by the price before VAT. The offers are live; the choice of module was fixed on that day.
Scorecard for this module: open its page on ComparePV.
Cheapest current offers for JA Solar JAM54D40-470/LR, prices read 9 Oct 2026.
| Shop | Market | Price | Availability |
|---|---|---|---|
| PV Zenit | Poland | 335 zł incl. VAT | In stock |
| Eco System Projekt | Poland | 339 zł incl. VAT | In stock |
| Solar-EM | Poland | 341 zł incl. VAT | In stock |
Each price is the figure the shop printed, on its own side of VAT.
What this estimate leaves out
The consumption is an example. A heat pump or an electric car adds to it, and the count scales in proportion.
The yields are PVGIS long-term averages for a free-standing system at the best angles; a real roof has its own tilt, direction and shade. PVGIS also reports how much the yield varies from year to year, so check that before you call a weak year a fault. The performance ratio separates the weather from the system.
The count uses the rating on the label, because that's what an offer sells, and every label carries a power tolerance. The losses PVGIS assumes are already in the yield.
Modules lose a little power every year, so a system sized to the first year covers a little less of your use later. If you want the need covered in year twenty, size up by the degradation the datasheet states.
Shop prices change daily, and the cost figures are medians as of the last pull.
Figures and denominators
How the figures above were computed. Every figure is recomputed from the catalogue and the live shop offers when the page is served, and each one counts only the modules or offers that publish the value.
The consumption of 4,000 kWh a year is an example input, not a measured or typical figure; the arithmetic scales in proportion to your own. The yields are from the European Commission's PVGIS 5.3 calculator for 1 kWp of crystalline silicon modules, free-standing, at the optimal fixed tilt and orientation, with its default 14 % system loss: 1,052.59 kWh per kWp a year in Warsaw, 1,140.73 in Munich and 1,671.76 in Seville. The links are in the sources.
The catalogue holds 14,005 listable modules; the figures cover those that state a rated power, without the rows that restate one module at an assumed rear-side gain. For each module, the count is the needed power divided by the module's rated power, rounded up to a whole module; the table gives the median and the 10th and 90th percentiles of that count across the catalogue. The area is that count times the module's outer length and width, for modules that state both.
The module cost is the needed power times the median price per watt of single rooftop modules (400 to 800 W) in live shop offers in that market, before VAT, in euro at the day's ECB reference rate. It covers modules only.
All 15 figures on this page and what each counts
| Figure | Value | Computed over |
|---|---|---|
| Modules stating a rated power, rear-side gain rows left out | 14,005 | 14,005 modules |
| Rated power at STC, 10th percentile | 370 W | 14,005 modules |
| Rated power at STC, 90th percentile | 655 W | 14,005 modules |
| Rated power at STC, median | 495 W | 14,005 modules |
| 4000 kWh a year in Warsaw: module area, 10th percentile | 17.6 m² | 13,990 modules |
| 4000 kWh a year in Warsaw: module area, 90th percentile | 20.7 m² | 13,990 modules |
| 4000 kWh a year in Munich: module area, 10th percentile | 15.6 m² | 13,990 modules |
| 4000 kWh a year in Munich: module area, 90th percentile | 19.1 m² | 13,990 modules |
| 4000 kWh a year in Seville: module area, 10th percentile | 10.8 m² | 13,990 modules |
| 4000 kWh a year in Seville: module area, 90th percentile | 13.7 m² | 13,990 modules |
| Module efficiency, 10th percentile | 19.6 % | 13,998 modules |
| Module efficiency, 90th percentile | 23.2 % | 13,998 modules |
| Poland: modules for 3.80 kWp (4000 kWh a year in Warsaw) at the median price per watt, before tax | 555 EUR | 1,171 offers |
| Germany: modules for 3.51 kWp (4000 kWh a year in Munich) at the median price per watt, before tax | 622 EUR | 233 offers |
| Modules in the catalogue | 14,005 | 14,005 modules |