Sharp GSD8K66H-740WT vs IBC Solar YH720W-33MHD/MH
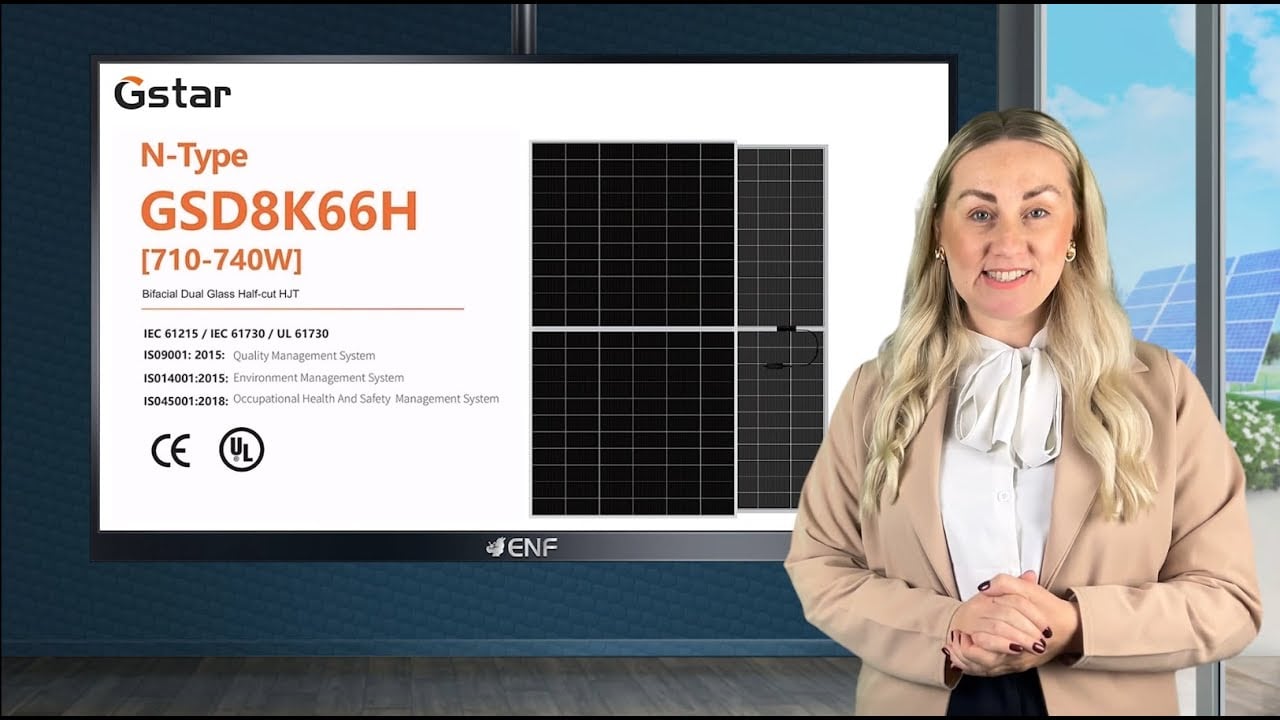
VS
The verdict
GSD8K66H-740WT leads on the differences that matter
The largest is temperature coefficient: 0.090 %/°C better in heat. 8 of 18 comparable parameters are identical, with 1 more left out because at least one datasheet does not publish it.
See all 10 differencesHow alike are they
8
of 18 comparable
parameters are identical
parameters are identical
identical
differs
not published
01
10 of 18 parameters
What actually differs
Parameter
GSD8K66H-740WT
YH720W-33MHD/MH
Difference
Temperature coefficient
-0.260 %/°C
-0.350 %/°C
0.090 %/°C better in heat
Module efficiency
23.82 %
23.18 %
0.64 pp more efficient
Product warranty
25 yrs
30 yrs
5 yrs longer
Power density
238.2 Wp/m²
231.8 Wp/m²
6.4 Wp/m² higher
Rated power
740 Wp
720 Wp
20 W more power
Cell technology
HJT
TOPCon
HJT vs TOPCon
Open-circuit voltage
51.70 V
49.82 V
1.88 V apart
Weight
39.0 kg
38.0 kg
1.0 kg lighter
Voltage at max power
43.80 V
41.52 V
2.28 V apart
Dimensions
2384x1303x35 mm
2384x1303x33 mm
2384x1303x35 mm vs 2384x1303x33 mm
02
What it means on a roof
Thirty years of production
Declared first-year losses, with 0.40% a year afterwards assumed for both panels, at 1,200 kWh/kWp a year
GSD8K66H-740WT
24,828 kWh
YH720W-33MHD/MH
24,157 kWh
Lifetime gap
671 kWh
Output when it is hot
Rated power carried across the range a module actually sees
Scenario
GSD8K66H-740WT
YH720W-33MHD/MH
Standard test conditions
25 °C
100.0% of rated power
740 W
720 W
Cool, bright day
40 °C
94.8% of rated power
711 W
682 W
Typical summer roof
55 °C
89.5% of rated power
682 W
644 W
Hot roof
70 °C
84.2% of rated power
653 W
607 W
03
Full specification
Parameter
GSD8K66H-740WT
YH720W-33MHD/MH
Difference
Power and efficiency
Rated power
740 Wp
720 Wp
+20 W for GSD8K66H-740WT
Module efficiency
23.82 %
23.18 %
+0.64 pp for GSD8K66H-740WT
Power density
238.2 Wp/m²
231.8 Wp/m²
+6.4 Wp/m² for GSD8K66H-740WT
Open-circuit voltage
51.70 V
49.82 V
1.88 V apart
Voltage at max power
43.80 V
41.52 V
2.28 V apart
Short-circuit current
17.76 A
18.13 A
Effectively the same
Current at max power
16.91 A
17.34 A
Effectively the same
Temperature
Temperature coefficient
-0.260 %/°C
-0.350 %/°C
+0.090 %/°C for GSD8K66H-740WT
Mechanical
Dimensions
2384x1303x35 mm
2384x1303x33 mm
2384x1303x35 mm vs 2384x1303x33 mm
Module area
3.106 m²
3.106 m²
Same
Weight
39.0 kg
38.0 kg
-1.0 kg for YH720W-33MHD/MH
Weight per kWp
52.7 kg/kWp
52.8 kg/kWp
Effectively the same
Warranty and degradation
Product warranty
25 yrs
30 yrs
+5 yrs for YH720W-33MHD/MH
Performance warranty
30 yrs
30 yrs
Same
Annual degradation
0.35 %/yr
-
Not published by IBC Solar
Technology
Cell technology
HJT
TOPCon
HJT vs TOPCon
Cell type
Monocrystalline
Monocrystalline
Same
Cell count
132
132
Same
Bifacial
Yes
Yes
Same
04
14,005 panels
Against the whole database
Efficiency
#418
vs
#1,424
GSD8K66H-740WT leads by 1,006 places
Power density
#431
vs
#1,347
GSD8K66H-740WT leads by 916 places
Heat behaviour
#511
vs
#10,419
GSD8K66H-740WT leads by 9,908 places
Weight
#6,344
vs
#6,459
GSD8K66H-740WT leads by 115 places
Warranty
#21
vs
#21
Tied - the same position in the database
Overall
#12
vs
#24
GSD8K66H-740WT leads by 12 places
05
Open the full database
More useful comparisons
Same series, other bin
Sharp
Sharp GSD8K66H-740WT vs Sharp GSD8K66H-735WT
The same specification on paper
Same series, other bin
Sharp
Sharp GSD8K66H-740WT vs Sharp GSD8K66H-730WT
3 differences, the largest is module efficiency
Same series, other bin
Sharp
Sharp GSD8K66H-740WT vs Sharp GSD8K66H-725WT
3 differences, the largest is module efficiency
Same series, other bin
Sharp
Sharp GSD8K66H-740WT vs Sharp GSD8K66H-720WT
3 differences, the largest is module efficiency
Same series, other bin
Sharp
Sharp GSD8K66H-740WT vs Sharp GSD8K66H-715WT
5 differences, the largest is module efficiency
Same series, other bin
Sharp
Sharp GSD8K66H-740WT vs Sharp GSD8K66H-710WT
6 differences, the largest is module efficiency
06
Written summary
Checking cache...
07
Questions about this pairing
Which panel is better: Sharp GSD8K66H-740WT or IBC Solar YH720W-33MHD/MH?
According to our database: Sharp GSD8K66H-740WT has higher module efficiency (23.82% vs 23.18%); Sharp GSD8K66H-740WT tolerates heat better (temp coeff -0.260%/°C vs -0.350%/°C). See the full spec comparison and 30-year energy simulation above for a complete picture.
What is the efficiency of Sharp GSD8K66H-740WT and IBC Solar YH720W-33MHD/MH?
Sharp GSD8K66H-740WT has a module efficiency of 23.82%, while IBC Solar YH720 W-33MHD/MH is 23.18%. Higher efficiency means more electricity from the same roof area - useful when space is limited.
What cell technology does Sharp GSD8K66H-740WT use vs IBC Solar YH720W-33MHD/MH?
Sharp GSD8K66H-740WT uses HJT cells; IBC Solar YH720 W-33MHD/MH uses TOPCon. Modern n-type technologies (TOPCon, HJT, BC) typically deliver higher efficiency and lower degradation compared to older PERC (p-type) cells.
What is the warranty on Sharp GSD8K66H-740WT and IBC Solar YH720W-33MHD/MH?
Sharp GSD8K66H-740WT has a 30 years power warranty; IBC Solar YH720 W-33MHD/MH has a 30 years power warranty. The power warranty guarantees a minimum percentage of rated output at the end of the warranty period (typically 80-87%). Product (materials) warranties are usually shorter.
Are Sharp GSD8K66H-740WT and IBC Solar YH720W-33MHD/MH bifacial panels?
Both Sharp GSD8K66H-740WT and IBC Solar YH720 W-33MHD/MH are bifacial - they capture reflected light from the ground, which can add 5-15% more annual energy on ground-mount or elevated rooftop installations with a light surface beneath.
Shop prices: See 6 Sharp offers · See 2 IBC Solar offers
Every figure here is from the manufacturers' own datasheets - a dash means the value is not published, never an estimate. The thirty-year projection and the temperature scenarios are calculations from those figures, and each states its assumption above.